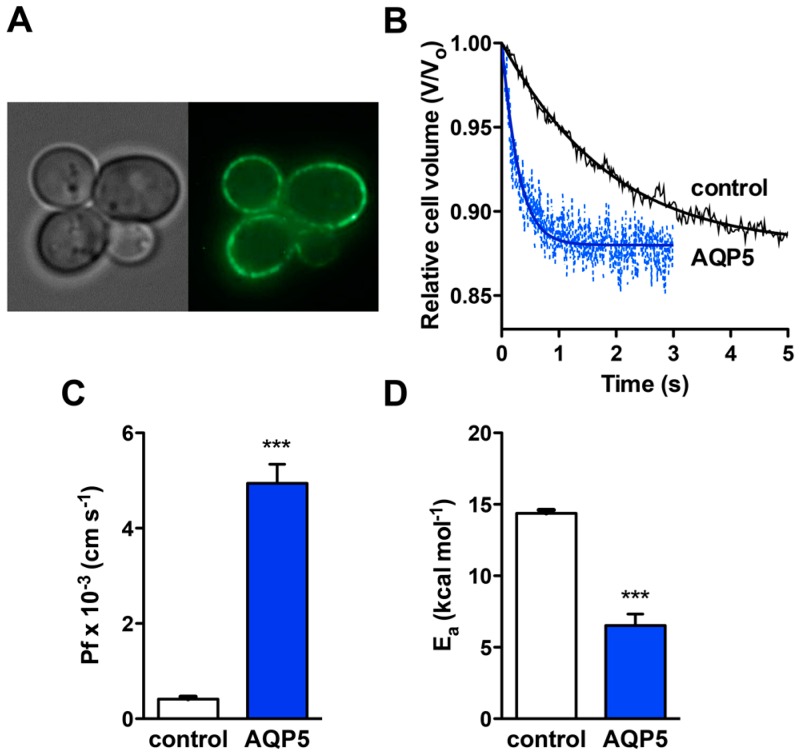
Figure 1.
Expression and function of rat AQP5 (Aquaporin-5) in yeast. (A) Epifluorescence images of GFP-tagged AQP5 localization (green) in yeast cells (100× objective); (B) Representative time course of the relative cell volume (V/V0) changes after a hyperosmotic shock inducing cell shrinkage (pH 7.4); (C) Water permeability coefficients of control (Pf = (0.41 ± 0.05) × 10−3 cm·s−1) and cells expressing AQP5 (Pf = (4.94 ± 0.40) × 10−3 cm·s−1), measured at 23 °C and pH 7.4. Data are mean ± SD of 10 measurements; (D) Activation energies (Ea) for water permeation of control and AQP5 cells (15.16 ± 0.85 and 6.52 ± 0.82 kcal·mol−1, respectively). Data are mean ± SD. *** p < 0.001.

