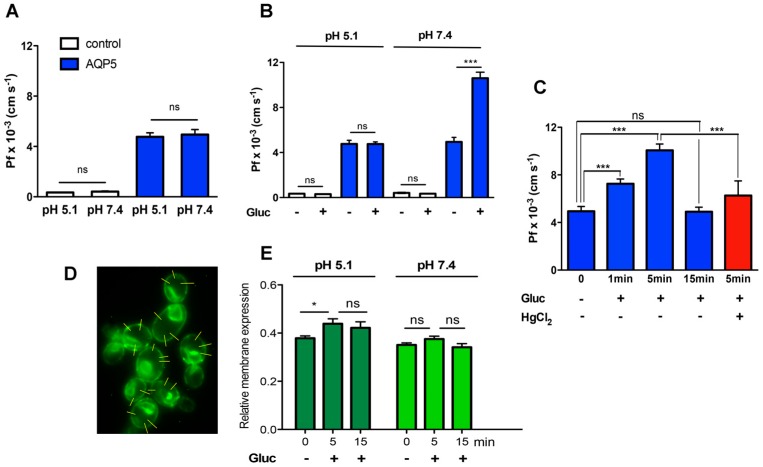
Figure 2.
Regulation of AQP5 water permeability. (A) Water permeability Pf at pH 5.1 and pH 7.4 of control cells (Pf = (0.35 ± 0.01) × 10−3 and (0.41 ± 0.05) × 10−3 cm·s−1, respectively) and yeast cells expressing AQP5 (Pf = (4.77 ± 0.32) × 10−3 and (4.94 ± 0.40) × 10−3 cm·s−1, respectively); (B) Water permeability Pf at pH 5.1 and pH 7.4 upon an external glucose pulse (C) Time course of glucose-induced phosphorylation (1, 5 and 15 min, pH 7.4) and inhibition of AQP5 by HgCl2 0.05 mM. Data are mean ± SD of 10 measurements; (D) Representative epifluorescence images of GFP-tagged AQP5 localization in yeast cells (100× objective); linear intensity profiles are indicated (yellow lines); and (E) Relative membrane expression of AQP5 calculated from fluorescence intensity profiles (30 cells in each experimental condition, 3 profiles for each cell, from at 3 independent experiments). ns, non significant, * p < 0.5, *** p < 0.001.

