Figure 5.
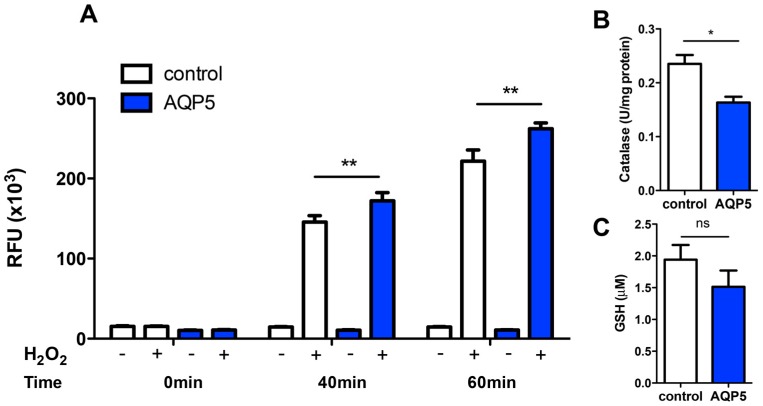
Cellular levels of ROS (oxidant), GSH and catalase (antioxidants). (A) Time course of Intracellular ROS production after acute stress induction with 20 mM H2O2; (B) Catalase activity and (C) total intracellular GSH content of yeast strains. Values are means ± SD of triplicates, ns, non significant, * p < 0.05, ** p < 0.01.

