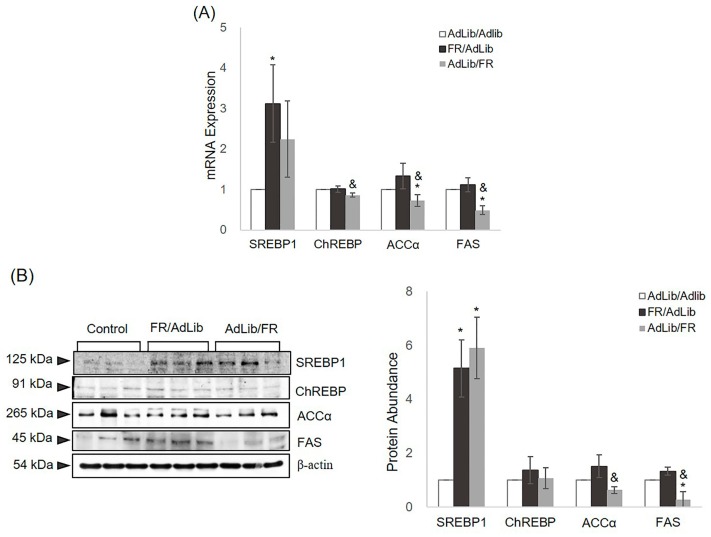
Figure 3.
Relative mRNA and protein levels of hepatic lipid metabolism-related genes in three-week-old male offspring. (A) The levels of mRNAs encoding SREBP1, ChREBP, ACCα, and FAS were determined by real-time PCR in the three groups (n = 9 control, n = 9 FR/AdLib, and n = 9 AdLib/FR). Each value was calculated using the ΔΔCt method (the cycle threshold value method) normalized to that of GAPDH. Data are presented as means ± SDs; (B) the protein expression levels of SREBP1, ChREBP, ACCα, and FAS were measured by Western blotting in the three groups (n = 9 control, n = 9 FR/AdLib, and n = 9 AdLib/FR). β-actin served as the reference protein for normalization of band intensities. Data are presented as means ± SDs. p-values indicate the significance of the differences among the groups (one-way ANOVA). * (p < 0.05) vs. control, and & (p < 0.05) vs. FR/AdLib or AdLib/FR. SREBP1, sterol regulatory element-binding protein 1; ChREBP, carbohydrate-responsive element-binding protein; ACCα, acetyl-CoA carboxylase alpha; FAS, fatty acid synthase.

