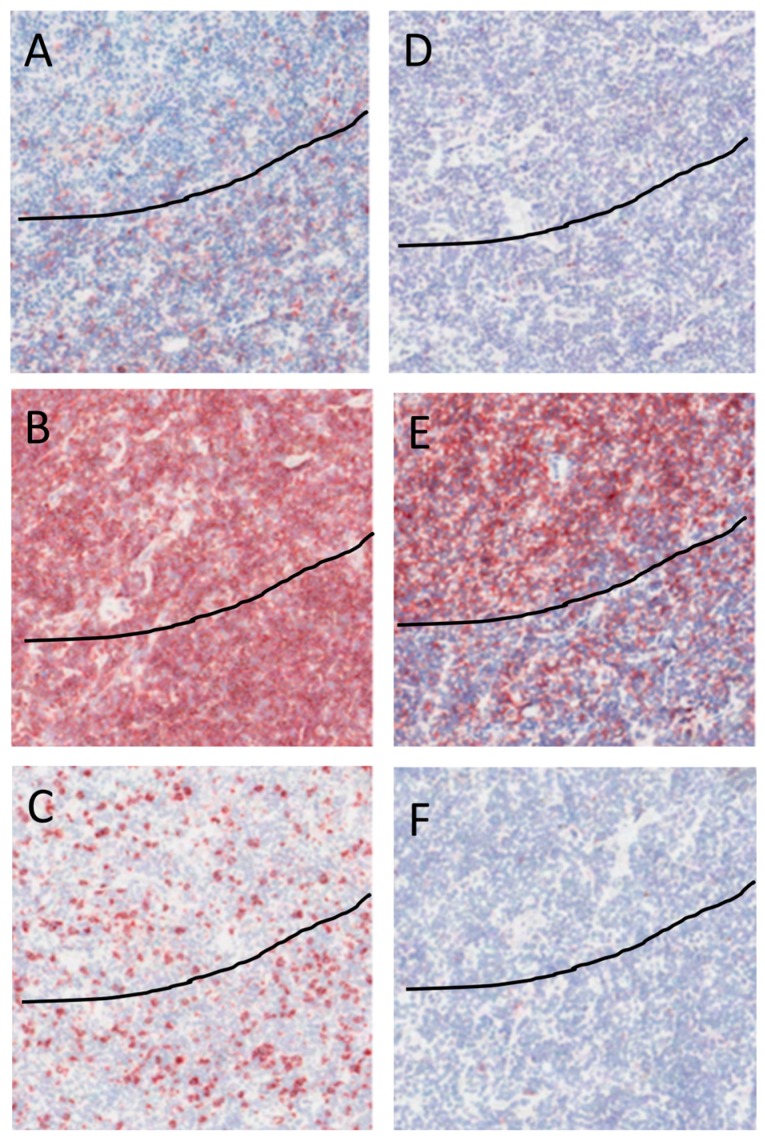
Figure 3.
Immunohistochemistry of a representative NLPHL case. All figures show the same area of tumor with magnification 40×. The line discriminates between the tumor cell rich area, i.e., area above line, from the tumor cell depleted area. Positive staining is visualized in red, counterstaining of the nucleus with hematoxylin is blue. (A) CD26+ cells are found mainly outside the tumor area; (B) CD4+ cells are scattered all over the tissue; (C) CD8+ cells are scattered all over the tissue; (D) No expression of Foxp3 in the cells in tumor area, few Foxp3 positive cells are present outside of the tumor area; (E) Aggregation of CD69 stained cells in the tumor area; and (F) Few CD25 stained cells in the tumor area and out of the tumor area.

