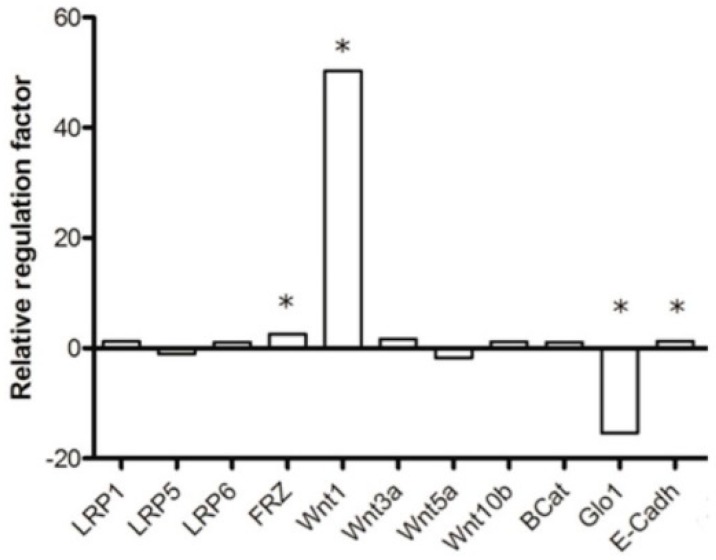
Figure 4.
Expression of key genes of the WNT/β-catenin signaling pathway in MCF-7 shRNA-GLO1 cells. The plot shows the up- or downregulation of mRNA expression relative to mock-transfected control cells as fold-change calculated by the ΔΔCt method (REST©2009 Software downloaded from http://www.wzw.tum.de/gene-quantification/) using the Ct values from the genes of interest normalized to the Ct values of GAPDH mRNA (housekeeping gene). Statistical significance was determined by Student’s t-test with: n = 3 and * p < 0.05.

