Fig. 1.
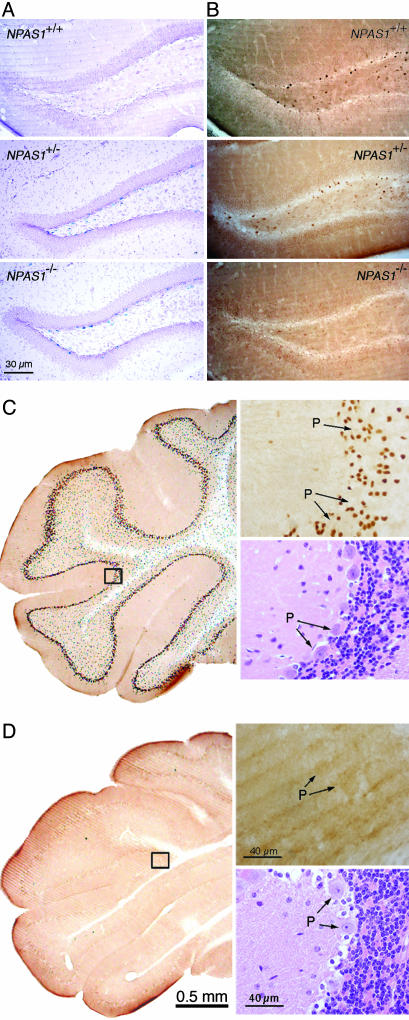
Samples of NPAS1 and NPAS3 expression in the adult mouse brain. (A) Patterns of β-galactosidase enzyme activity in coronal sections of brain tissue derived from wt (Top), NPAS1+/– (Middle), and NPAS1–/– (Bottom) animals. (B) Staining patterns of matching tissue samples with antibodies prepared against recombinant NPAS1 protein. NPAS1-positive cells are observed in wt (Top) and NPAS1+/– (Middle) samples, but absent in the NPAS1–/– sample (Bottom). (C) Coronal sections of the cerebellum from a wt mouse immunohistochemically processed with the antibody to NPAS3. NPAS3-positive neurons are seen in the granular layer of the cerebellum immediately outside of the Purkinje (P) cell layer. (Upper Right) Shown is the high-magnification image of the boxed area (Left), revealing nuclear, antibody-reactive material. (Lower Right) Shown is hematoxylin/eosin staining of an analogous region of the cerebellum prepared from a wt mouse. (D) Coronal section as in C but from an NPAS3–/– mouse. Despite the absence of antibody-reactive material in the cerebellum of the NPAS3–/– sample (Upper Right), the hematoxylin/eosin staining pattern (Lower Right) could not be distinguished from wt.

