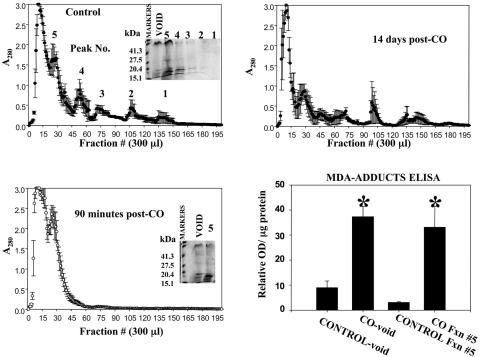
Fig. 2.
Column chromatography and analysis of acid-soluble material from brain. (Upper Left) Pattern for control rats. (Lower Left) Pattern for rats killed 90 min after CO poisoning. (Upper Right) Pattern for rats killed 14 days after CO poisoning. Identical protein amounts were loaded onto CM columns, and the results are mean ± SE for four rats in each group. (Lower Right) Data from an ELISA demonstrating the presence of MDA adducts in void and fraction 5 material obtained from control rats and rats killed 90 min after CO poisoning (mean ± SE, n = 4). *, P < 0.05, ANOVA. (Insets) SDS/PAGE patterns for the various fractions.

