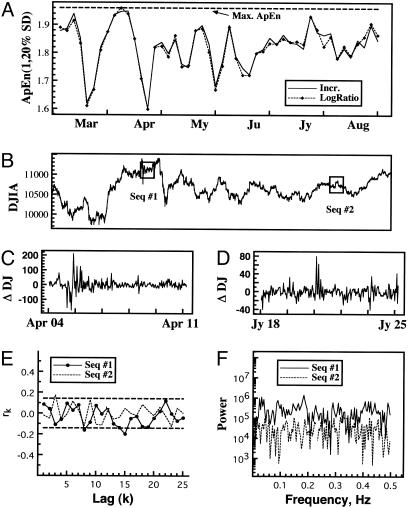
Fig. 1.
Analysis of subtle asset variation. (A) Dow Jones running ApEn(1, 20% SD, N = 200) values, applied to both incremental and “log-ratio” 10-min price series. (B) Concomitant Dow Jones Industrial Average (DJIA) index values, from February 11, 2000, to August 18, 2000. (C and D) Incremental series (Seq. #1 and #2) for periods April 4–10, ApEn = 1.600 (C) and July 18–24, ApEn = 1.778 (D). (E) Autocorrelograms (and 95% confidence intervals) for Seq. #1 and #2. (F) Power spectra for Seq. #1 and #2. Observe highly significant ApEn variation over time; also note that ApEn indicates significant differences in regularity between the time series underlying C and D, and, moreover, between each series and a maximal ApEn level of 1.949. In contrast, neither autocorrelation nor the power spectrum distinguish either segment shown in C and D from random.

