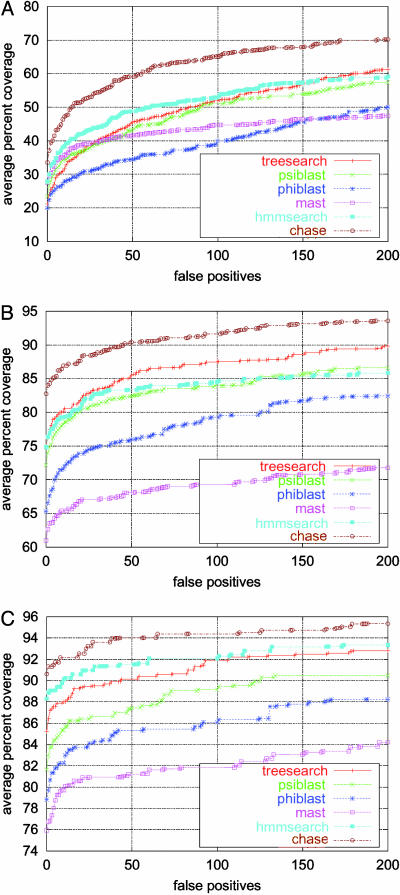
Fig. 2.
Coverage versus false-positive counts. Shown is the phase4 evaluation in the form of coverage vs. false-positive counts for chase as well as for the five component algorithms using three different scenarios (as described in Table 1) offered in phase4. Averaging is done over all scop families included in the even half of the database. (The odd half was used to determine the weights used by the chase combination scheme.)

