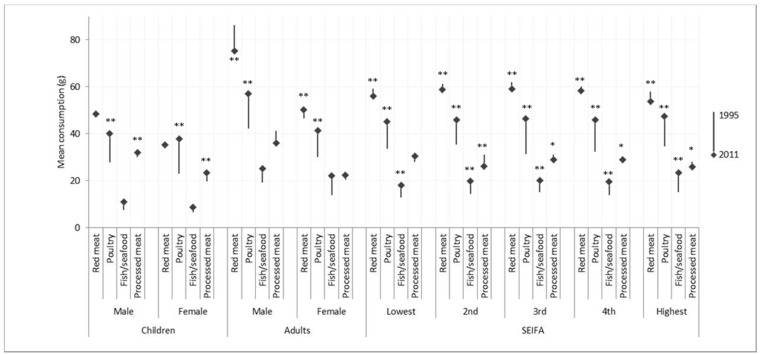
Figure 1.
Per-capita mean consumption (g) of meat/poultry/fish from 1995 to 2011–2012, in children and adults, separated by gender, and SEIFA category. * p-value < 0.05 from Mann–Whitney U test; ** p-value < 0.01 from Mann–Whitney U test; ―◆ The start of the arrow indicates the per-capita consumption of meat/poultry/fish at 1995; the end of the arrow (capped by a square) indicates the per-capita consumption of meat/poultry/fish at 2011; the length of the arrow indicates the change of the per-capita consumption of meat/poultry/fish from 1995 to 2011–2012.

