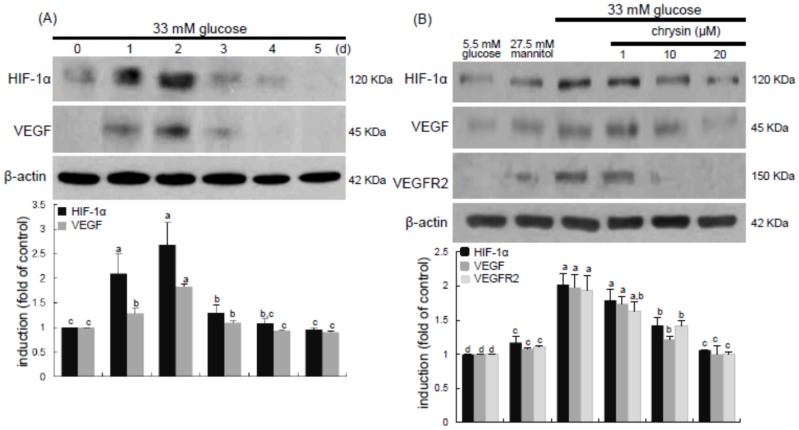
Figure 2.
Time course responses of induction of HIF-1α and VEGF by high glucose (A) and inhibition of HIF-1α, VEGF, and VEGFR2 by chrysin (B). HRMVEC were incubated with 33 mM glucose in the absence and presence of 1–20 μM chrysin up to five days. Cells were also incubated with 5.5 mM glucose and 27.5 mM mannitol as osmotic controls. Cell lysates were subject to Western blot analysis using a primary antibody against HIF-1α, VEGF, or VEGFR2. β-Actin protein was used as an internal control. Bar graphs (mean ± SEM, n = 3) in the bottom panels represent densitometric results of upper blot bands. Means not sharing a common letter differ, p < 0.05.

