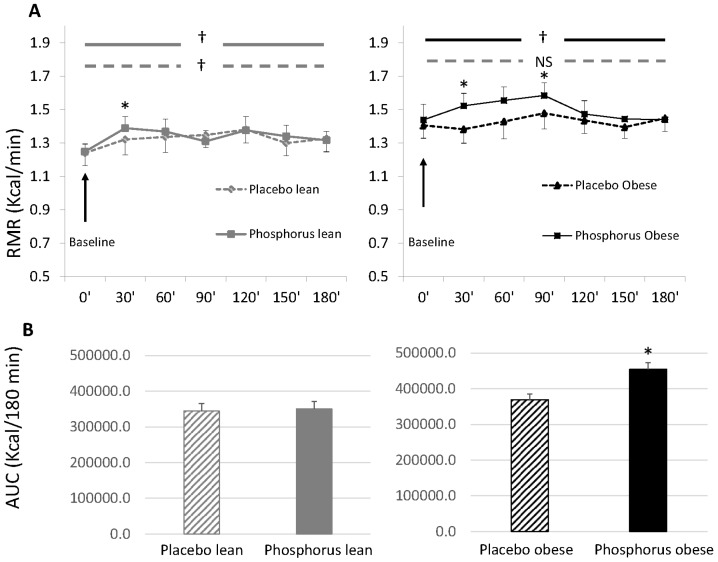
Figure 1.
Diet-induced thermogenesis after drinking 75 g glucose solution with and without phosphorus supplementation in lean and obese subjects. (A) Resting metabolic rate at baseline and over 3 h (180 min) after drinking 75 g glucose solution in lean and obese subjects with phosphorus (solid lines) or placebo (dashed lines); (B) Total area under the curve of RMR over 3 h (180 min) after drinking 75 g glucose solution with phosphorus (solid bars) or placebo (dashed bars) in lean and obese subjects. Data are Mean ± SEM. * p < 0.05 vs. placebo (paired t-test); † p < 0.05: within-subjects comparison (repeated measures); NS: not significant (repeated measures); RMR: resting metabolic rate; AUC: area under the curve; SEM: standard error of the mean.

