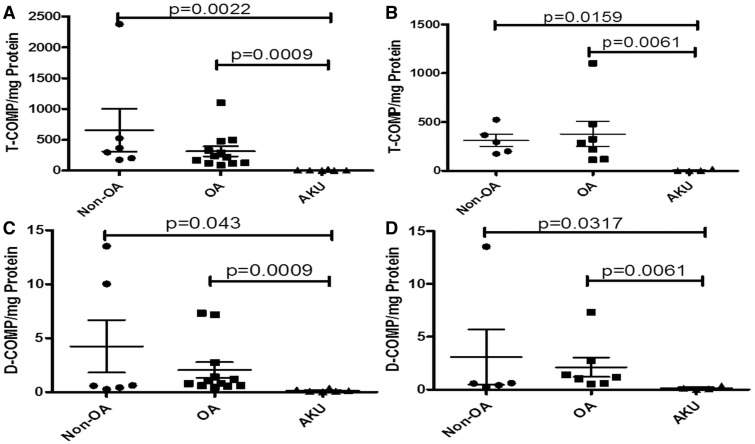
Fig. 4.
Lower total COMP and lower deamidated COMP in alkaptonuria cartilage compared with OA and non-OA cartilage
Graph showing extractable T-COMP (T-COMP per milligram protein) from AKU (n = 6), OA (n = 12) and non-OA (n = 6) cartilage specimens. (A) All samples, both hips and knees. (B) Hip-only samples. Graph showing extractable D-COMP (D-COMP/mg protein) from AKU (n = 6), OA (n = 12) and non-OA (n = 6) cartilage specimens. (C) All samples, both hips and knees. (D) Hip-only samples. Error bars represent the mean of the n in each group ±95% CI. D-COMP: deamidated COMP; T-COMP: total COMP; AKU: alkaptonuria.

