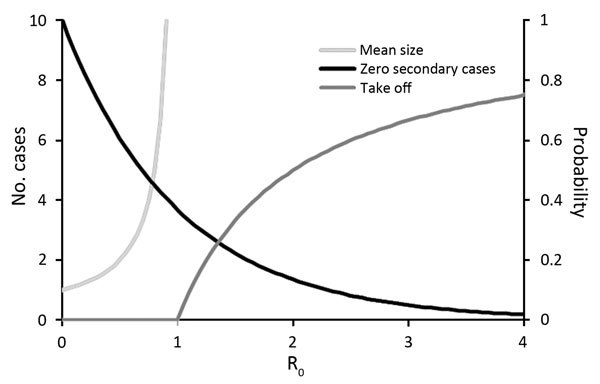
Figure 2.

Expected outbreak dynamics for RNA and DNA viruses given a single primary case in a large, previously unexposed host population, as a function of the basic reproduction number R0. Mean size of outbreak as total number of cases (N) is given by N = 1/(1 − R0) for R0<1 (light gray line, left axis). Probability of 0 secondary cases (i.e., outbreak size N = 1) is given by P1 = exp(−R0) (black line, right axis). Probability of a major outbreak is given by Ptakeoff = 1 – 1/R0 for R0>1 (dark gray line, right axis).
