
Figure 3.
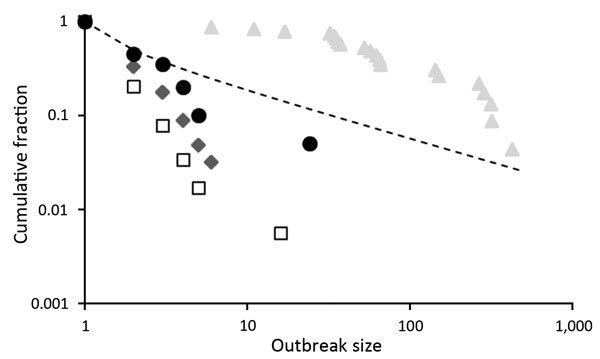
Distribution of outbreak sizes for RNA and DNA viruses as plots of outbreak size x (horizontal axis) versus fraction of outbreaks of size >x (vertical axis), both on logarithmic scales. Data are shown for 4 infectious diseases. Squares indicates Andes virus disease in South America (24); diamonds indicate monkeypox in Africa (26); circles indicate Middle East respiratory syndrome in the Middle East (25); and triangles indicate filovirus (all species) diseases in Africa before 2013 (27). For comparison, expected values for the case R0 = 1, obtained from the expression for the probability of an outbreak of size >x, P(x) = Γ(x – 1/2)/√πΓ(x), are also shown (dashed line). Data for filoviruses are not consistent with expectation for R0<1.