
Figure 2.
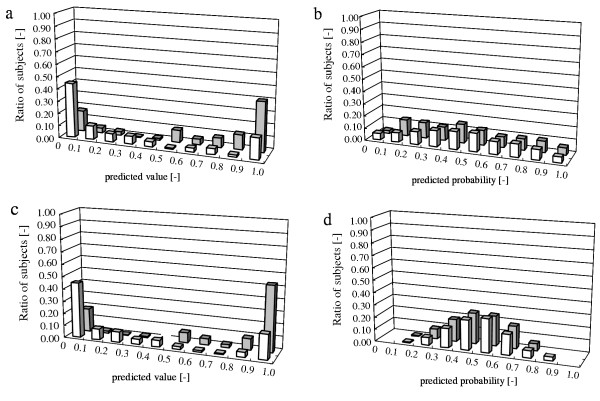
Diagnostic prediction of ANN (a) and LR (b) using 25 SNPs, and prediction of ANN (c) and LR (d) using the 10 selected SNPs. Prediction results of evaluation data are presented. Gray and white bars represent frequency of case subjects and control subjects, respectively.