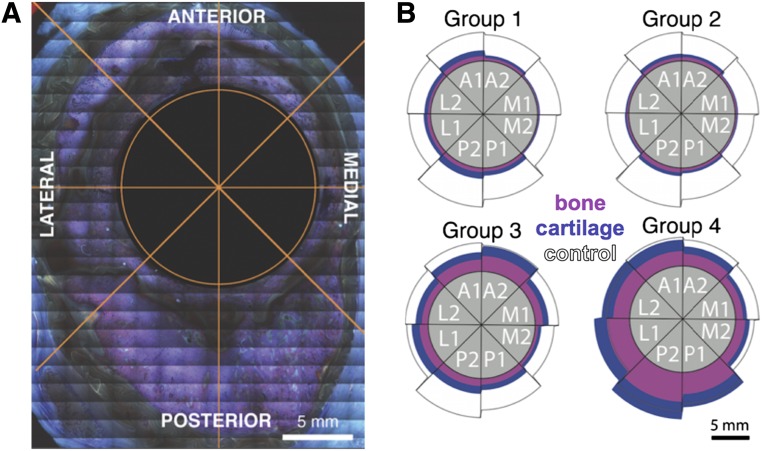
Figure 3.
Spatial distribution of tissue genesis. (A): For digital processing and analysis of high-resolution image collages, an octant was overlaid over the entire cross-section, centered on the intramedullary nail cross-section. (B): Total tissue genesis as well as the relative amounts of mineralized (pink) and cartilage tissue (blue) were measured in each sector, including lateral (L1, L2), anterior (A1, A2), medial (M1, M2), and posterior (P1, P2) aspects. The gray circle represents the intramedullary nail (1.5 cm diameter), and the black-outlined white areas show the comparative control area to demonstrate normal tissue distribution. Group 4 showed a greater area of regenerated tissue in the lateral and posterior quadrants than that observed in a normal femur.

