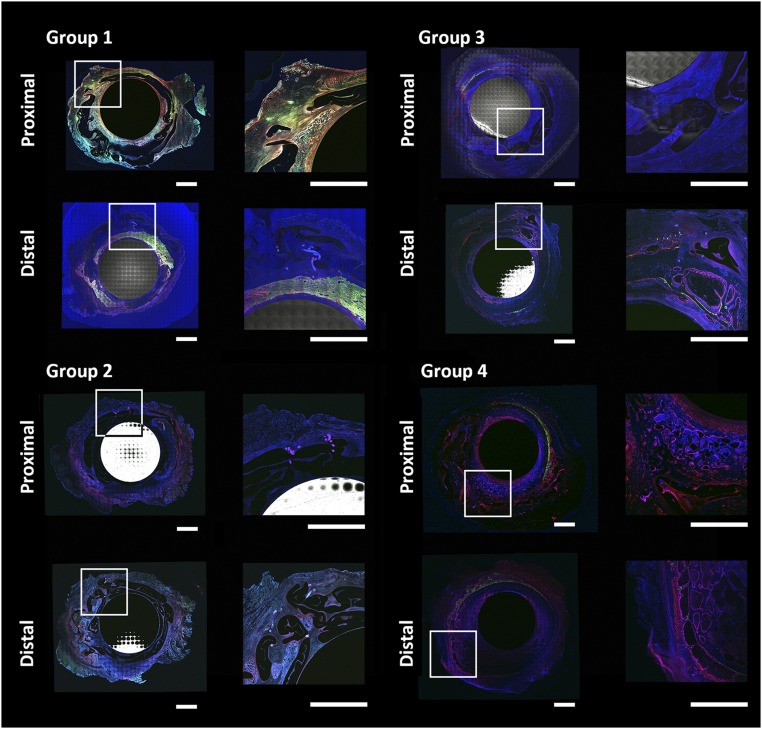
Figure 6.
Representative cross-section (collage of high-resolution laser scanning fluorescence images) from each group, showing relationship between tissue genesis and bounding surfaces. Shown is the stainless steel intramedullary nail in the center and silicone elastomer membrane bounding the defect, with tissue genesis within and outside membrane surfaces but not between folds. Fluorescence shows tissue genesis over time, with green indicating tissue generated between 1 and 2 weeks after surgery; orange, 3 and 4 weeks; yellow, 8 and 12 weeks; and red, perfusion (immediately before euthanasia). Elastomer membrane is visible in gray and sutures as discrete blue circles (orthogonal to plane of image) and lines (in plane) in zoomed-in insets. Scale bar = 0.5 cm.

