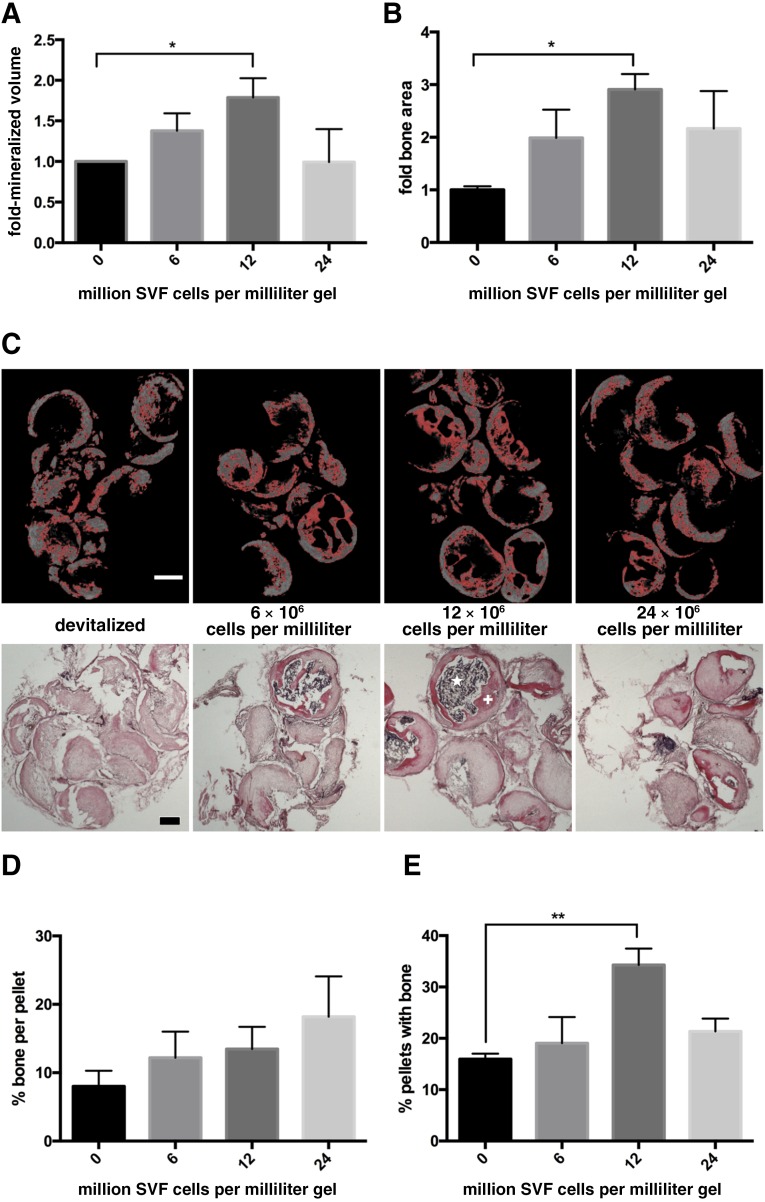
Figure 3.
Effect of stromal vascular fraction (SVF) cell number. Following ectopic implantation, the amount of mineralized bone volume, quantified by microtomography (A) or the area covered by bone tissue, assessed in histological slides stained by hematoxylin and eosin (H&E) (B), was expressed as fold difference of the nonactivated grafts and plotted versus the number of embedded SVF cells (n = 5–6 grafts assessed per group). ∗, p < .05, mean and standard error of the mean. (C): Representative microtomography sections, with pixels marked in red corresponding to the selected density threshold (top panels) and H&E-stained sections (bottom panels) used to generate the data displayed in panels A and B. Scale bars = 500 µm. Percentage of osteoid matrix area per total pellet area (D) and percentage of implanted pellets with osteoid matrix formation (E) (n = 5–6 grafts assessed per group). ∗∗, p < .01, mean and standard error of the mean. +, osteoid matrix; ⋆, bone marrow. Abbreviation: SVF, stromal vascular fraction.

