Figure 5.
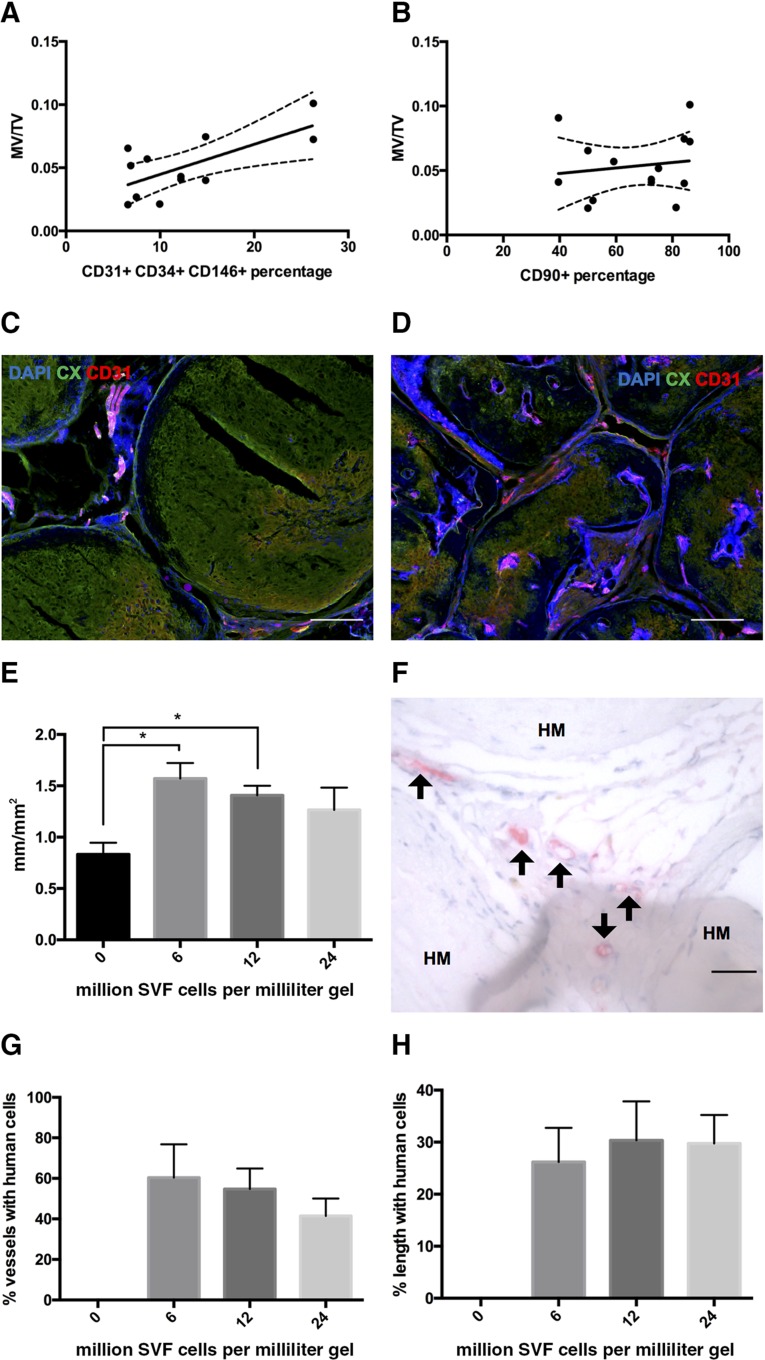
Contribution of stromal vascular fraction (SVF) cell lineages. Plots of mineralized tissue volume per total tissue volume versus the percentage of embedded CD31+ CD34+ CD146+ (R2= 0.4756, p = .013) (A) or CD90+ SVF cells (R2 = 0.0226, p = .608) (B). Dots represent single grafts. (C, D): Representative immunofluorescence staining for type X collagen, CD31, and 4′,6-diamidino-2-phenylindole of devitalized samples without (C) or with (D) SVF activation after 12 weeks in vivo. Scale bars = 200 µm. (E): Vessel length density calculated as total length of visible vessels per square millimeter of section (n = 5–6 grafts per group). ∗, p < .05, mean and standard error. (F): Immunohistochemistry and immunofluorescence staining for human CD34, identifying positive cells (arrows) between remnants of hypertrophic matrix. Scale bars = 50 µm. Percentage of vessels with human cells (G) and percentage of vessel length covered by human cells (H) (n = 5–6 grafts per group, mean and standard error). Abbreviations: CX, type X collagen; DAPI, 4′,6-diamidino-2-phenylindole; HM, hypertrophic matrix; MV, mineralized tissue volume; SVF, stromal vascular fraction; TV, total tissue volume.

