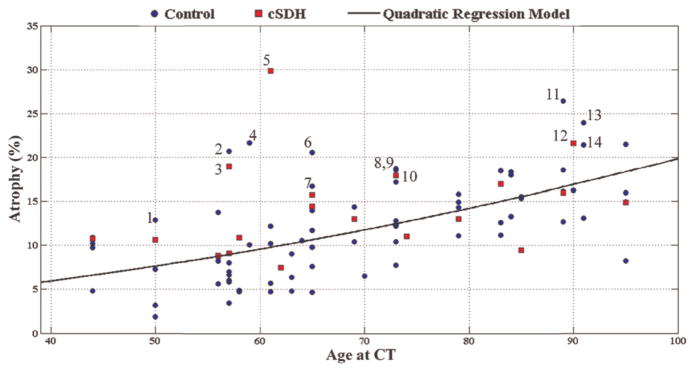
Figure 2.
Percentage cortical atrophy is plotted against age at CT scan in patients who had a chronic subdural haematoma diagnosed on the scan following the one analysed (cSDH group; red square). CT scans of age-matched controls (control group; blue circle) were also analysed. The linear regression model shown was derived from the control group. Fourteen data points with the largest residuals relative to the trend line are marked 1–14 (see Discussion).

