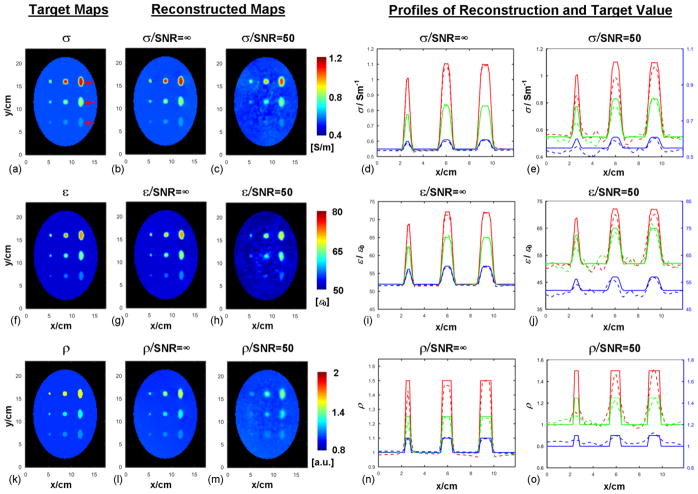
Fig. 2.
From left to right: (a), (f) and (k): Target maps of conductivity (σ), permittivity (ε) and proton density (ρ). Red arrows in (a) indicate the positions of the line profiles shown in the reconstruction plots. (b,) (g) and (l): Reconstructed σ, ε and ρ distribution in the absence of noise, respectively. (c), (h) and (m): Reconstructed σ, ε and ρ distribution when random noise was added into simulated B1 field, respectively. (d), (i) and (n): Line profiles of reconstructed σ, ε and ρ in the absence of noise, respectively. (e), (j) and (o): Line profiles of reconstructed σ, ε and ρ in the noise condition, respectively. The profiles of the bottom line are plotted based on the right y-axis for improved visualization. Red, green and blue lines represent the top, middle and bottom arrows shown in (a), respectively, with solid lines for target value and dashed lines for reconstructed results.

