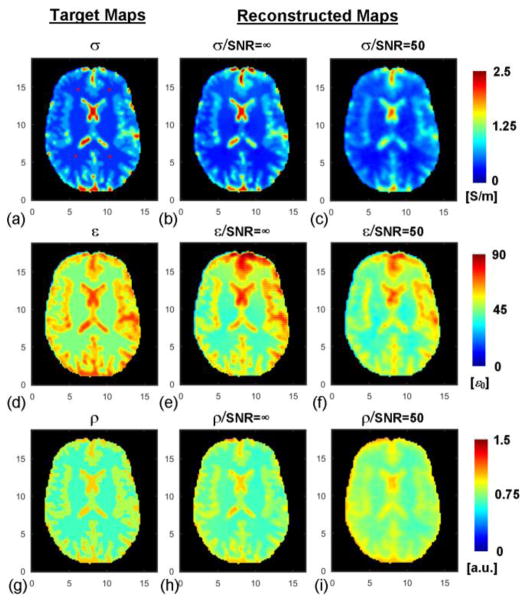
Fig. 3.
Duke head model and reconstruction results. From left to right: target distribution of conductivity (a), permittivity (d) and proton density (g) of the model; reconstructed conductivity (b), permittivity (e) and proton density (h) in the absence of noise; reconstructed conductivity (c), permittivity (f) and proton density (i) when noise was added. Red “*” in (a) represent the location of four seed points. The axis unit is cm.

