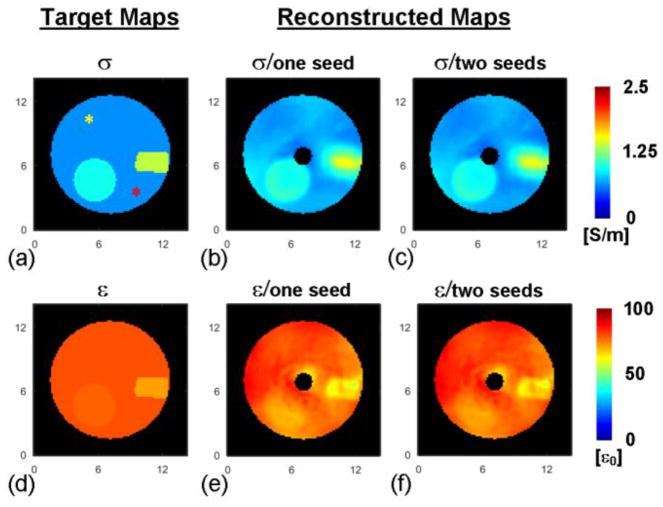
Fig. 5.
Left: drawings of the three phantom compartments with conductivity (a) and permittivity (d) values as measured with a probe. Yellow and red asterisks in (a) indicate the seed points. Middle: reconstructed conductivity (b) and permittivity (e) maps using one seed point located at the yellow asterisk in (a). Right: reconstructed conductivity (c) and permittivity (f) maps using two seed points in (a). The axis unit is cm.

