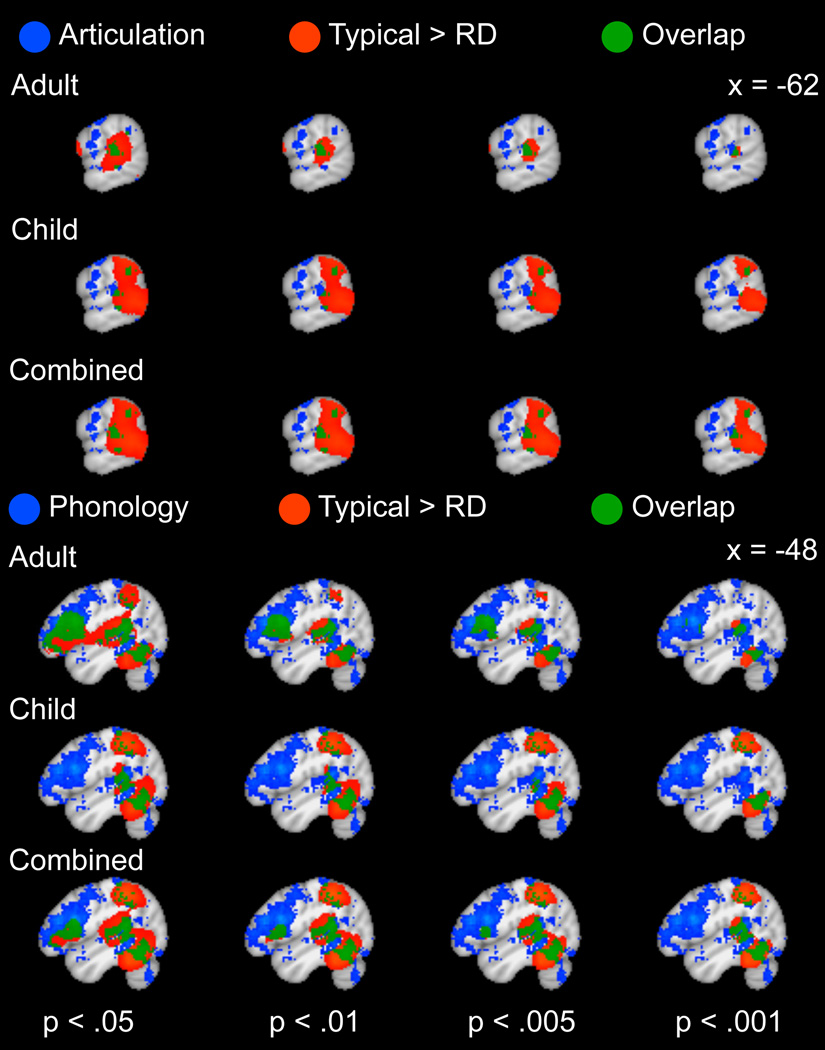
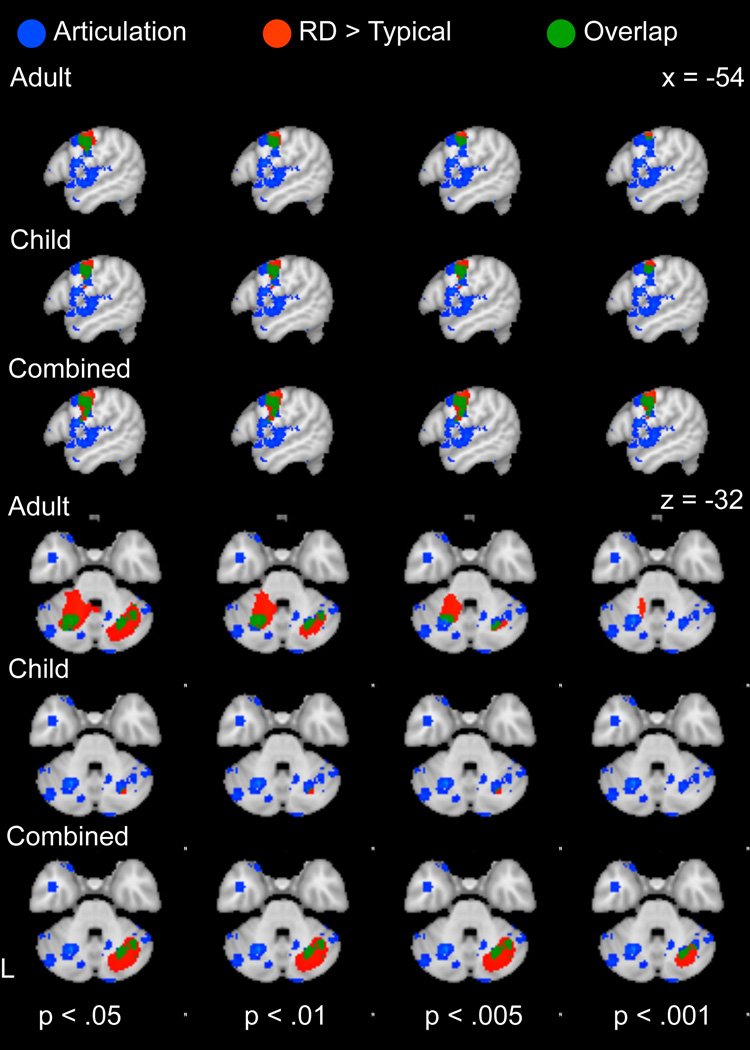
Figure 4.
(a) Comparison between regions involved in phonological processing (blue), identified using reverse inference with the Neurosynth database and cortical regions of decreased activation in RD relative to typical readers (red) based on a manual meta-analysis of RD studies, with overlap in green. (b) Comparison between regions involved in articulatory processing (blue), identified using reverse inference with the Neurosynth database and cortical regions of decreased activation in RD relative to typical readers (red) based on a manual meta-analysis of RD studies, with overlap in green. The results of the RD meta-analysis are presented at a voxel threshold of p < .05 to p < .001 to illustrate the stability of the overlap.


