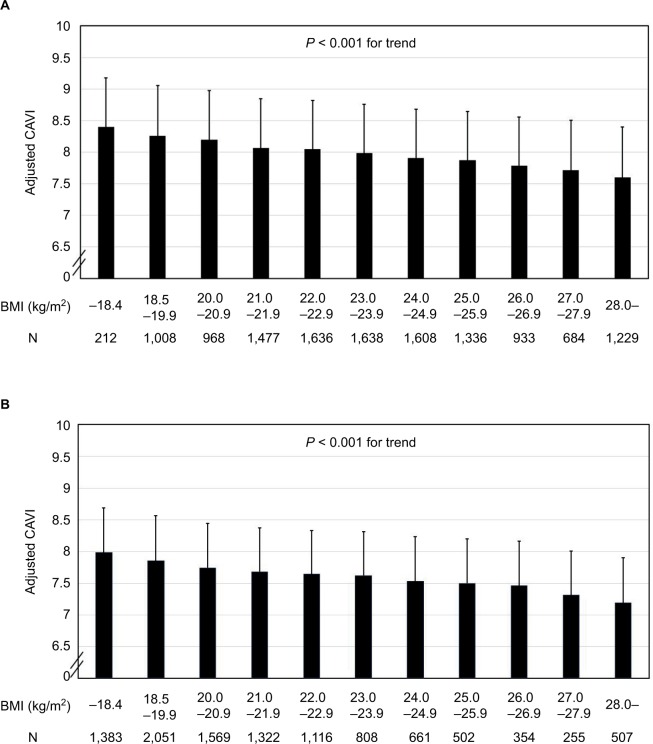
Figure 1.
Relationship between adjusted cardioankle vascular index and BMI in (A) male and (B) female subjects.
Notes: CAVI was adjusted by age, sBP, and HDL-C. Data are presented as mean ± standard deviation. A significant linear trend [F = 53.732, P < 0.001 in (A) and F = 61.386, P < 0.001 in (B)] was observed for the whole BMI distribution.
Abbreviations: BMI, body mass index; CAVI, cardioankle vascular index; sBP, systolic blood pressure; HDL-C, high-density lipoprotein-cholesterol.

