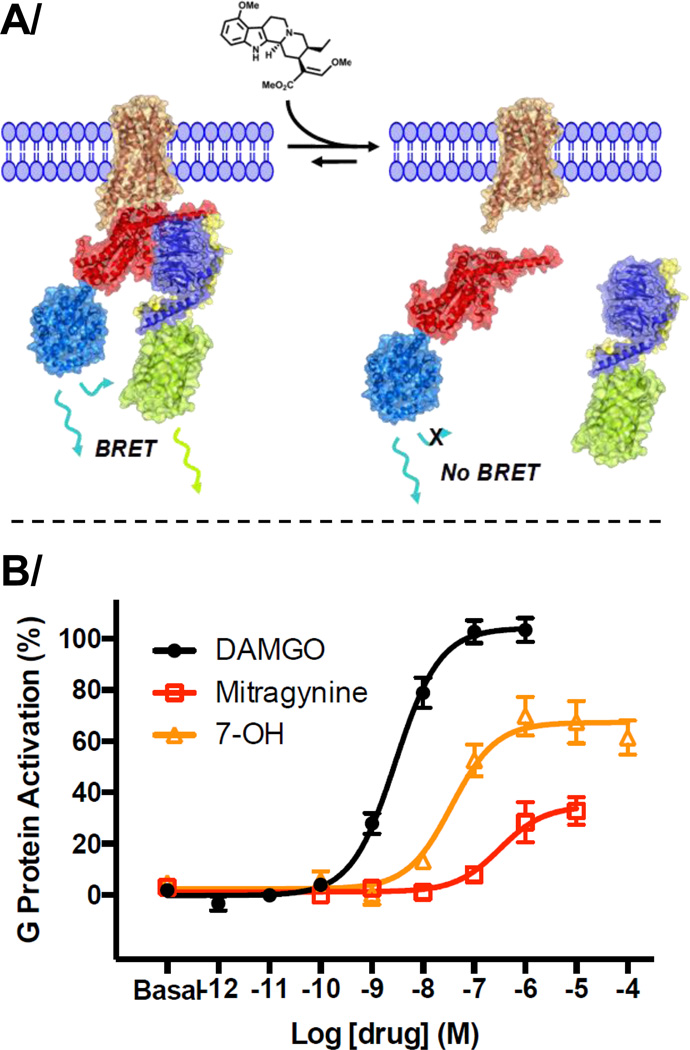
Figure 2.
Activity of mitragynine and 7-hydroxymitragyine (7-OH) at the human mu-opioid receptor (hMOR). (A) Conceptual representation of the G protein BRET assay employing atomistic cartoons derived from available x-ray crystal structures. To measure G protein activation, hMOR37 (brown) was co-expressed with GαoB38 (red) fused to RLuc839 (teal), β138 (blue), and mVenus40 (yellow-green) fused to γ238 (yellow). (B) Agonist activity at hMOR; positive control = [D-Ala2N-Me-Phe4, Gly-ol5]-enkephalin (DAMGO); curves represent the average of n≥3, with error bars representing ±SEM.

