
Table 3.
Agonist Activity of Synthetic Analogs at hMOR as Determined in G Protein BRET Assays
| Compound | Structure |
EC50 ± SEM (% efficacy) (µM) a |
|---|---|---|
| (-)-mitragynine | 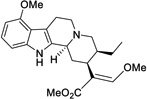 |
0.339 ± 0.178 (34%) |
| (+)-mitragynine | 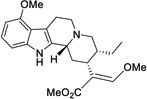 |
3.34 ± 1.1 (18%) |
| 1 | 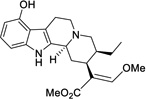 |
0.681 ± 0.379 (29%) |
| 2 | 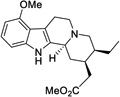 |
>50 |
| 11 | 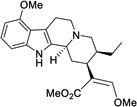 |
0.219 ± 0.071 (38%) |
| 3 | 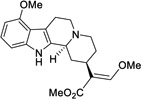 |
12 ± 7.6 (59%) |
a
Agonist activity at hMOR indicated by EC50 values, maximal efficacy (Emax) relative to DAMGO in parentheses; All data points represent mean ± SEM (µM) of n ≥ 3.