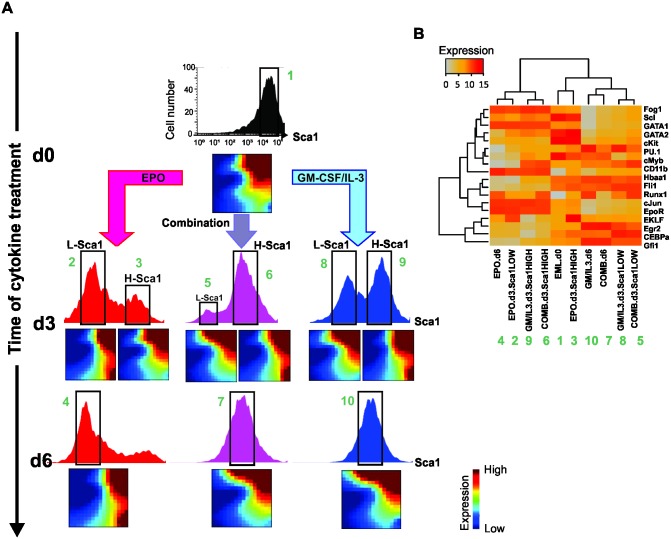
Fig 5. Whole-population transcriptome analysis reveals transient alternative program (rebellious cells).
(A) Sca1 surface expression population distribution in progenitor and cytokine-treated cells and transcriptomes of sorted subpopulations at indicated treatments/time points, displayed as GEDI self-organizing maps [44]. Progenitor EML cells were stimulated with EPO alone, with GM-CSF/IL-3 alone or with the combination of the two, and the Sca1-Medium (M) fractions (d0 and d6) and/or the Sca1-Low and -High subpopulations (d3) were FACS sorted for microarray analysis. (B) Hierarchical cluster analysis of the microarray-based transcriptomes of samples in A (columns, correspondence indicated by the green numbers) for a subset of the 17 genes analyzed in single-cell qPCR (rows). The entire experiment was performed twice in two laboratories with similar results. Color bar represents transcript expression values in log-scale (see Materials and Methods).

