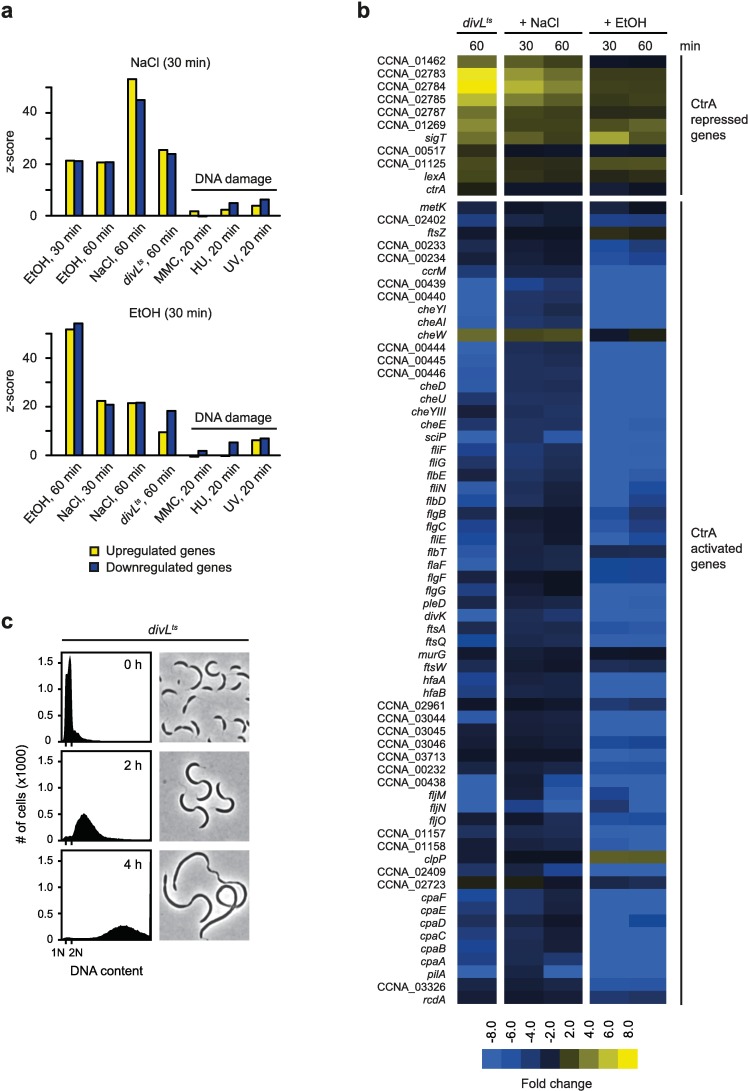
Fig 4. Salt and ethanol stress affect the regulon of the cell cycle master regulator CtrA.
(a) Comparison of RNA-seq data from the NaCl (upper graph) and EtOH (lower graph) stress condition with transcriptional data from other conditions. Z-scores indicate the level of similarity between two data sets that were compared. Z-scores for upregulated genes are shown in yellow, z-scores for downregulated genes are shown in blue. EtOH and NaCl conditions were compared with each other, with divLts data and with previously published DNA damage microarray data [26]. (b) RNA-seq data showing transcriptional changes of CtrA-regulated genes after DivL inactivation (divLts), treatment with 100 mM NaCl or treatment with 4% EtOH. (c) Flow cytometry profiles and phase contrast images of a divLts mutant before (0 hours) and after (2 and 4 hours) cultivation at the restrictive temperature (37°C).

