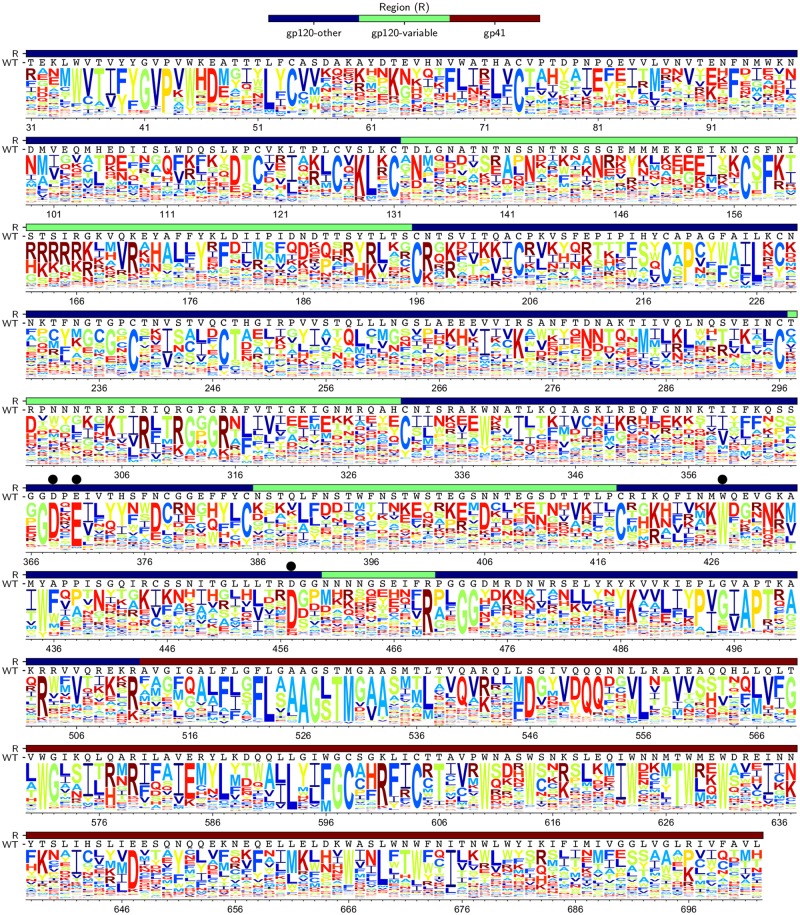
Fig 5. Env’s site-specific amino-acid preferences.
The amino-acid preferences averaged across replicates and re-scaled to account for differences in the stringency of selection between our experiments and natural selection. At each site, the preferences for each of the 20 amino acids sum to one, with the height of each letter proportional to the preference for that amino acid at that site. Letters are colored according to hydrophobicity. The overlay bar indicates the gp120 variable loops, other regions of gp120, and gp41. The LAI wildtype (WT) sequence is shown below the overlay bar. Black dots indicate sites where mutations are known to disrupt CD4 binding (Table 1). Sites are numbered using the HXB2 scheme [50]. Numerical values of the preferences before and after re-scaling are in S1 and S2 Files, respectively.

