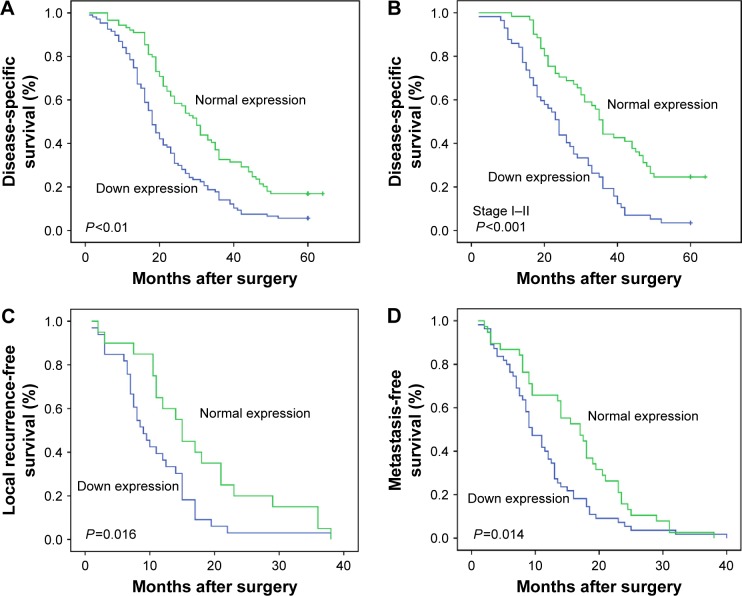
Figure 3.
Survival curves plotted by employing Kaplan–Meier estimator.
Notes: (A) Kaplan–Meier plot with univariate analysis indicated that patients with low AZGP1 expression had a poor DSS (P<0.01) than those with normal AZGP1 expression, log-rank test. (B) A stratified survival analysis according to the pathological stage revealed that AZGP1 expression discernibility on DSS was only pronounced in patients with advanced clinical stage (stage I–II; P<0.001), log-rank test. (C, D) Kaplan–Meier plot with univariate analysis indicated that patients with low AZGP1 expression had a poorer local recurrence-free (P=0.016) and metastasis-free survival (P=0.014) than those with normal AZGP1 expression, log-rank test.
Abbreviation: DSS, disease-specific survival.

