Figure 2.
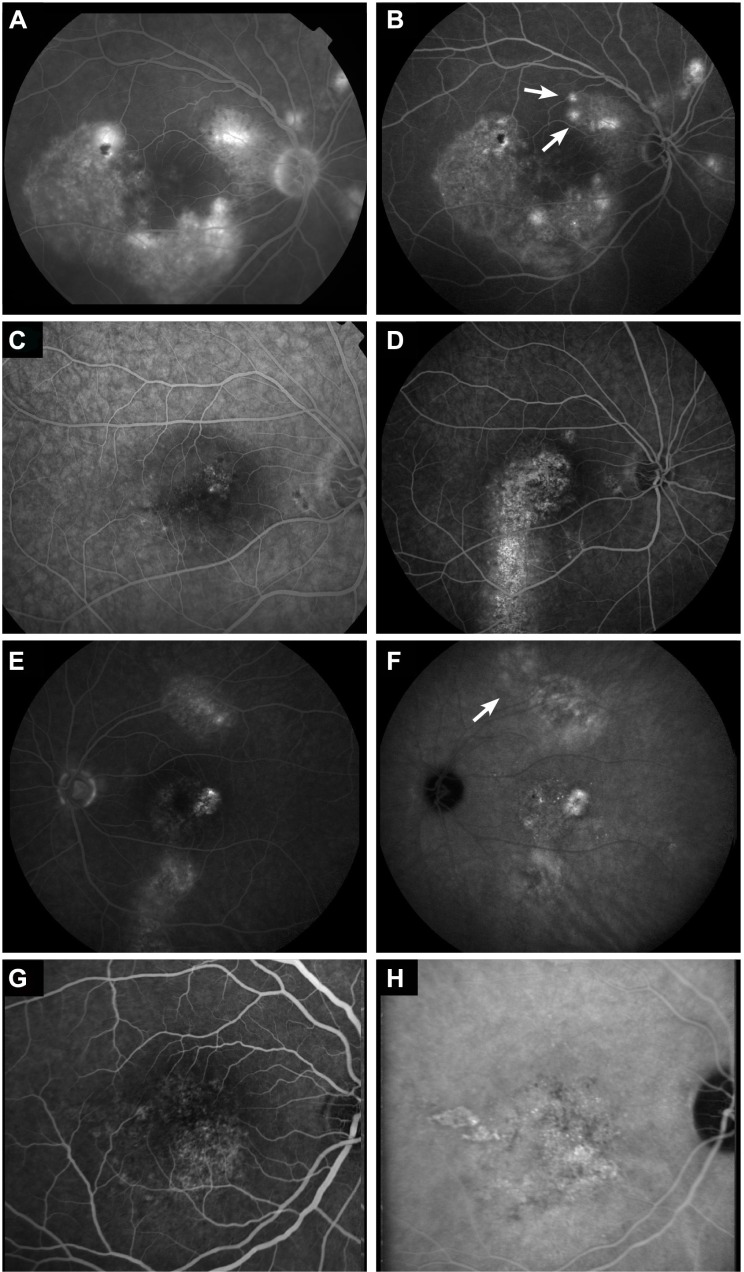
Abnormalities on fluorescein angiography (FA), indocyanine green angiography (ICGA), and fundus autofluorescence in chronic central serous chorioretinopathy.
Notes: (A, B) The appearance of “new” hot spots, highlighted by two arrows, on FA during 4 years of follow-up. (C, D) The development of a gravitational tract was observed originating from the initial leakage area after 6 years of follow-up. (E, F) Examples of differences seen in the extent of the hyperfluorescence areas between FA (E) and ICGA (F). The area depicted by the arrow shows clear hyperfluorescence on ICGA, but is not evident on the mid-phase FA. (G, H) ICGA (H) shows small punctiform hyperfluorescent areas in addition to diffuse hyperfluorescence. The corresponding FA (G) of the same patient shows an area of hyperfluorescence that is significantly smaller than the area seen on ICGA.

