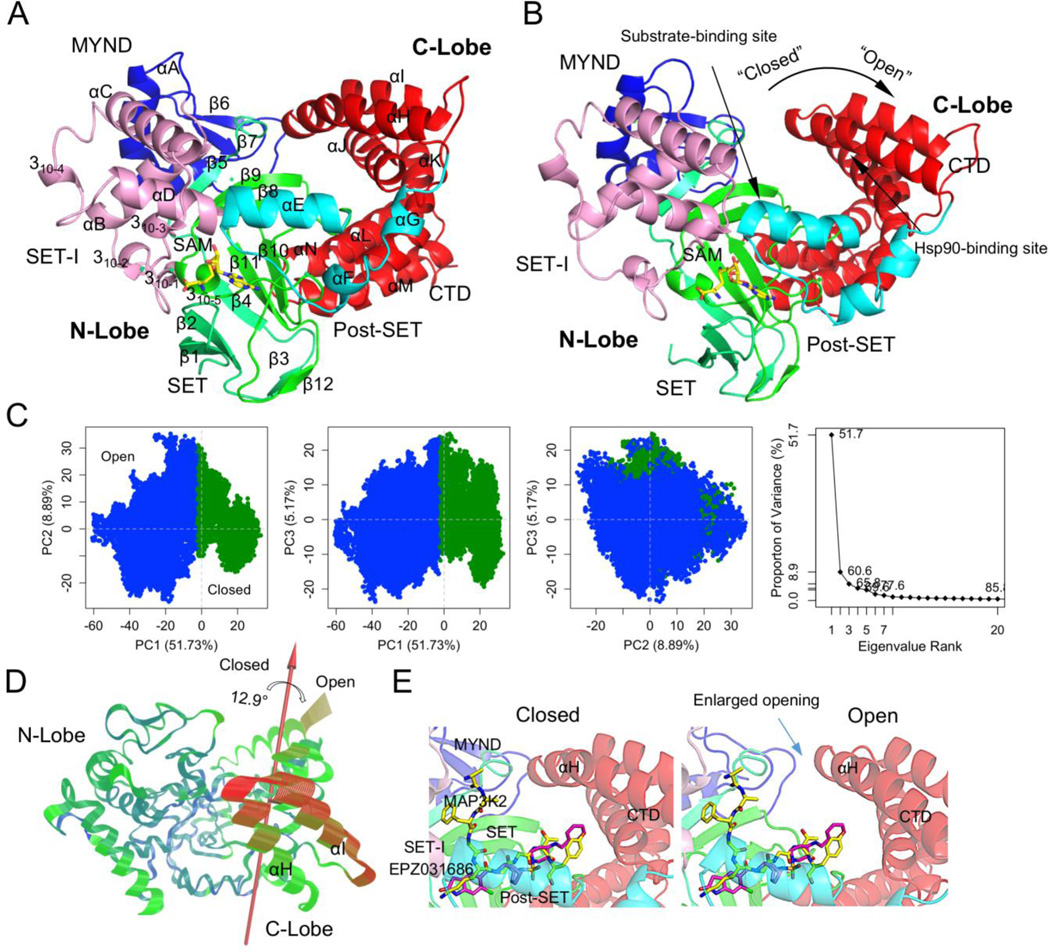
Figure 1.
New open conformation of SMYD3. (A) A closed-state and (B) open-state structure. SMYD3 is colored according to domain. Secondary structures are labeled and numbered according to their position in the sequence. (C) Principle component analysis (PCA) of full 50-ns trajectory. Left three, projection of the trajectory onto the planes formed by the first three principle components. Conformers are colored according to the k-means clustering. Rightmost, scree plot showing the proportion of variance against its eigenvalue rank. (D) Visualization of the motions along PC1. Color scale from blue, green, to red depicts low to high atomic displacements. (E) Superimposition of the open and closed states with an SMYD3 bound peptide (MAP3K2, yellow) and inhibitor (EPZ031686, purple).

