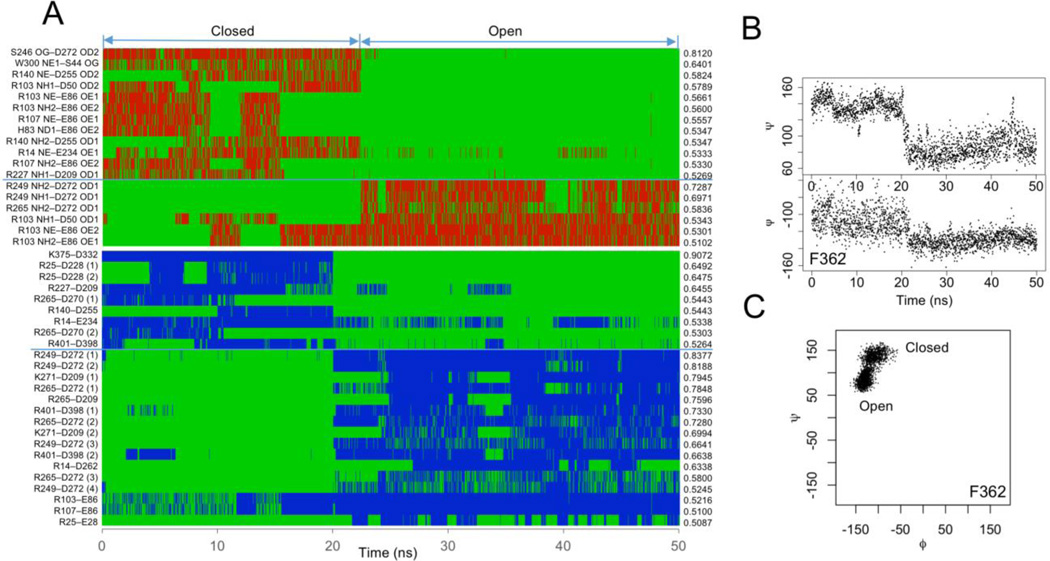
Figure 2.
Distinct structural characteristics. (A) Conformational state-correlated hydrogen bonds (top) and salt-bridges (bottom). Red and blue lines indicate the presence of interactions and green lines absence. (B) Torsion angles of F362 as a function of time. (C) Ramachandran plot of F362 trajectory.

