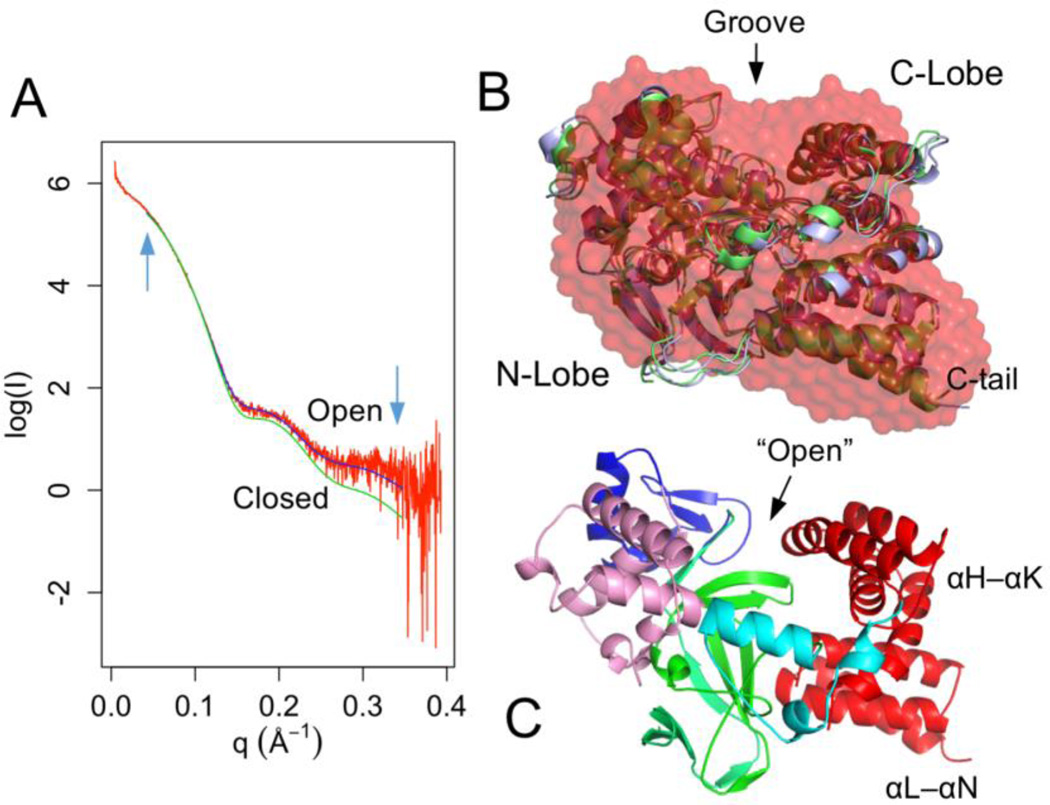
Figure 4.
Small-angle X-ray scattering. (A) Experimental scattering curve (red) overlaid with theoretical scattering curves calculated from a closed (green) and open (blue) SMYD3 structure. The q range used for model fitting is indicated by arrows. (B) Ab initio dummy atom model (red) superimposed with a closed (green) and open (blue) structure. (C) An open structure derived from normal mode analysis.

