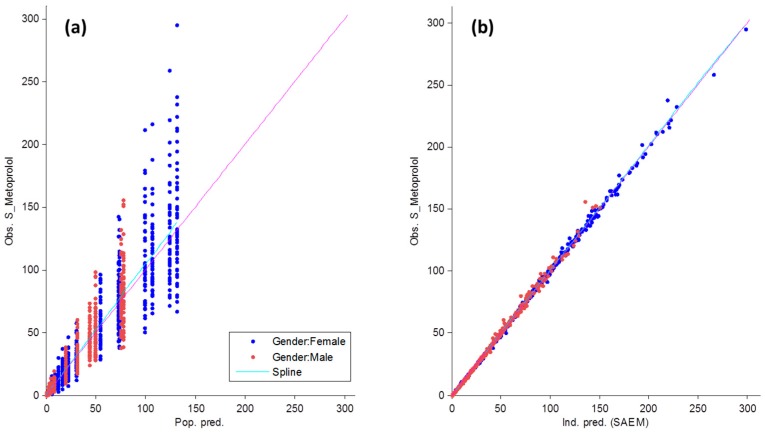
Figure 4.
Goodness-of-fit plots for the observed versus predicted model diagnostics of the population (a) fit and the individual (b) fit of metoprolol plasma concentrations in healthy young men and women. The x-axis in (a) is the population predicted plasma concentrations while the x-axis on the right (b) illustrates the individual predicted concentrations based on the Stochastic Approximation Expectation–Maximization (SAEM) algorithm. The y-axes are the observed metoprolol concentrations.

