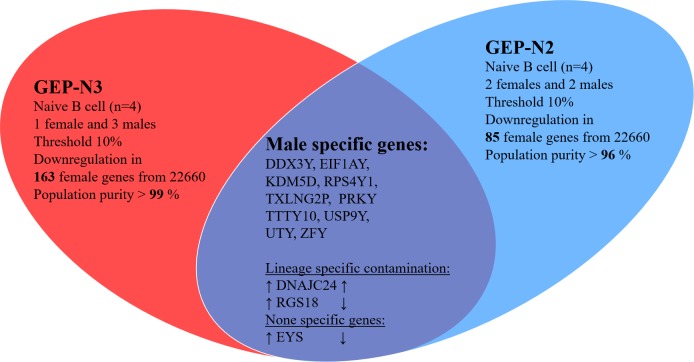
Figure 2. Gender specific gene in naive cells (genome-wide profiles, n = 8).
Venn diagram of results from whole-genome experimental sets GEP-N2 and GEP-N3 for gender specific genes in naive B cells. In two independent sets, three females and five male samples were investigated. Arrows indicate expression upregulation and downregulation in male.

