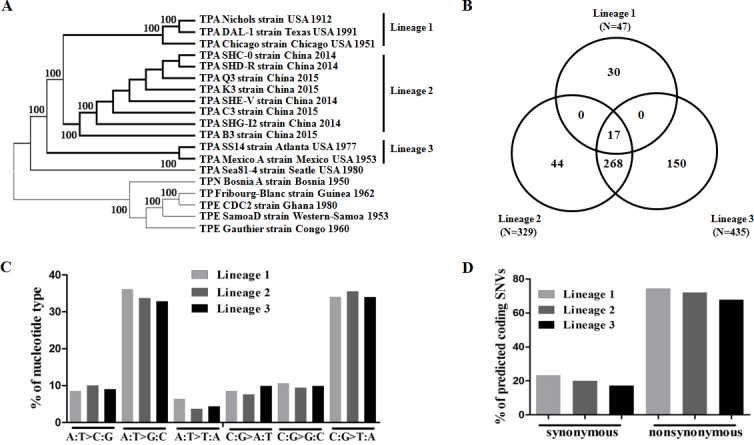
Figure 2. Characteristics of SNVs in different TPA lineages.

A. Neighbor-joining phylogeny analysis of 697 SNVs defining TPA lineages. B. Venn diagram showing the number of SNVs in different TPA lineages. C. Percentage of mutation spectra of SNVs in different TPA lineages. D. Percentage of nonsynonymous and synonymous SNVs in different lineages.
