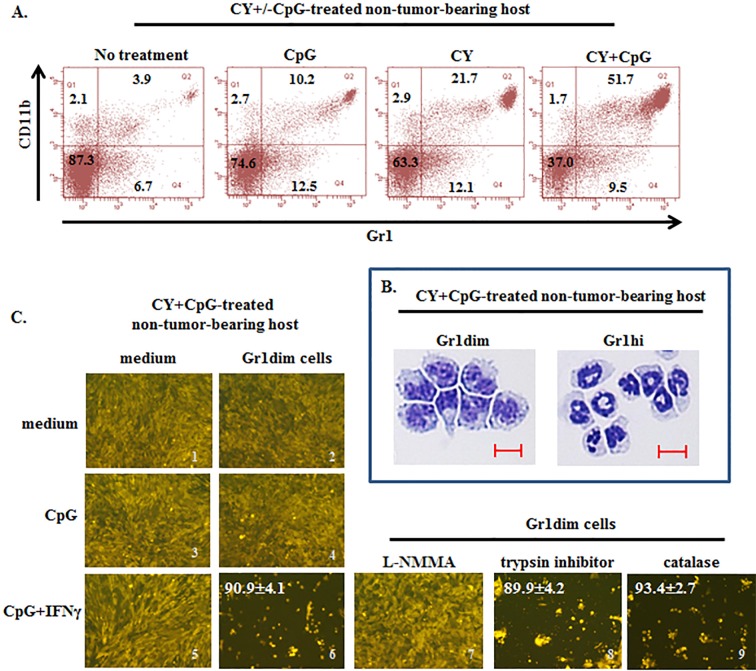
Figure 7. Induction of tumoricidal CD11b+Gr1dim cells in non-tumor-bearing mice by CY+CpG treatment.
A. Induction of double-positive CD11b+Gr1+ cells in spleens of non-TB mice treated with CpG, CY or CY+CpG compared to untreated naïve mice analyzed by flow cytometry. Numbers in the plots correspond to percentages of cells per quadrant. B. Representative pictures of cytospin analyses of isolated Gr1dim and Gr1hi cells from spleens of CY+CpG-treated non-TB mice. Scale bar, 10 μm. C. Evaluation of tumoricidal properties in Gr1dim cells isolated from CY+CpG-treated non-TB hosts. Representative photos of 4T1-f growth in the presence or absence of splenic Gr1dim cells from CY+CpG-treated non-TB mice stimulated in vitro with CpG or CpG+IFNγ. In additional wells containing Gr1dim splenocytes, 4T1-f and CpG+IFNγ, L-NMMA (iNOS inhibitor, 5mM), trypsin inhibitor (serine protease inhibitor, 4,000 U/ml) or catalase (ROS inhibitor, 4,000 U/ml) was added individually. Tumoricidal effect of Gr1dim cells was evaluated as in Figure 5A-5C. The percentage of tumor growth inhibition is denoted in white numbers (top left). Images without percentages represent confluent monolayers (killing below detection levels). Images were numerically labeled on the bottom right for the purpose of identification. Data are representative of 3 independent experiments. Three to five mice were pooled per experiment. All the studies were performed with cells isolated after mice received one round of treatment (c1d7). Representative photos shown in C correspond to 48h in culture. Photos were taken using a Zeiss Axio Observer A1 microscope. Statistical analysis for 4T1-f killing assay presented in results was performed using Student's t-Test.

