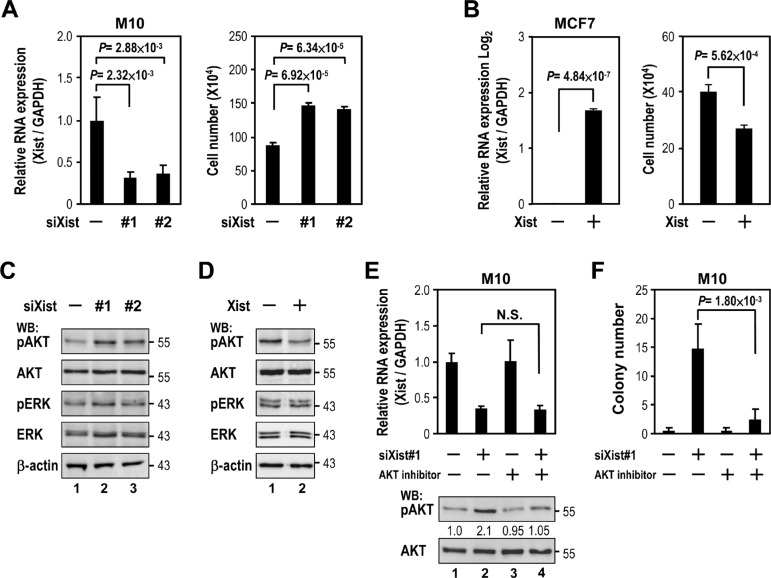
Figure 2. Xist downregulation increases cell viability via AKT activation.
(A) M10 cells were transfected with 10 nM specific siRNA oligonucleotides against Xist using RNAiMAX then subjected to quantitative RT-PCR (left panel) and viability assay (right panel). (B) MCF7 cells were transfected with Xist plasmid using Lipofectamine 3000 then subjected to quantitative RT-PCR (left panel) and viability assay (right panel). (C–D) Lysates from transfected M10 and MCF7 cells were immunoblotted with indicated antibodies. (E) Quantification RT-PCR and Western blotting of lysates from M10 cells transfected with Xist siRNA followed by AKT inhibitor treatment (250 nM, 2 days). Phospho- and non-phospho- AKT band intensity was quantified by densitometry. The ratio of phospho- to non-phospho protein is indicated after normalization to mock transfection and treatment samples. (F) Quantitative colony formation analysis of M10 cells transfected with Xist siRNAs and treated with or without 250 nM AKT inhibitor. Error bars: mean ± SD, n = 3.

