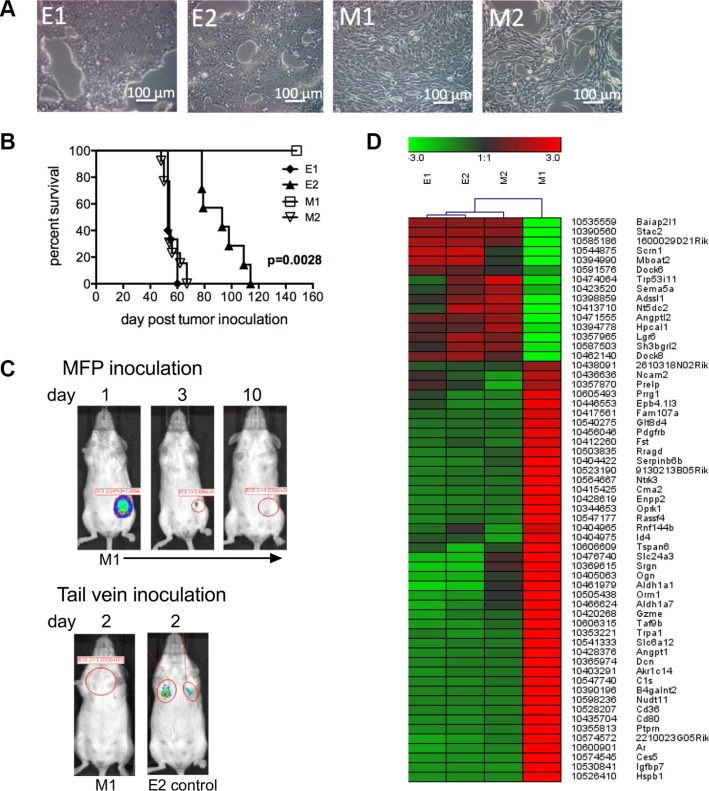
Figure 1. E1, E2 and M2 cells are tumorigenic.
(A) Bright field microscopy of clonal epithelial (E1 and E2) and mesenchymal-like (M1 and M2) cells. (B) Survival curves of mice inoculated into the MFP with 5 × 10⁴ cells from each of the E1 (n = 15), E2 (n = 7), M1 (n = 4) and M2 (n = 13) cell lines. Data was combined from 2 experiments. Mice were euthanized when tumor size reached 250 mm2. Significance was determined using the log-rank test. (C) Renilla luciferase bioluminescence in mice inoculated with 2 × 10⁶ M1 cells into the MFP or tail vein. Inoculation of E2 cells into the tail vein was used as a control. Figure C represents data collected from 4 mice. (D) Heat map of microarray analysis showing differences in E1, E2, M1 and M2 transcript expression.

