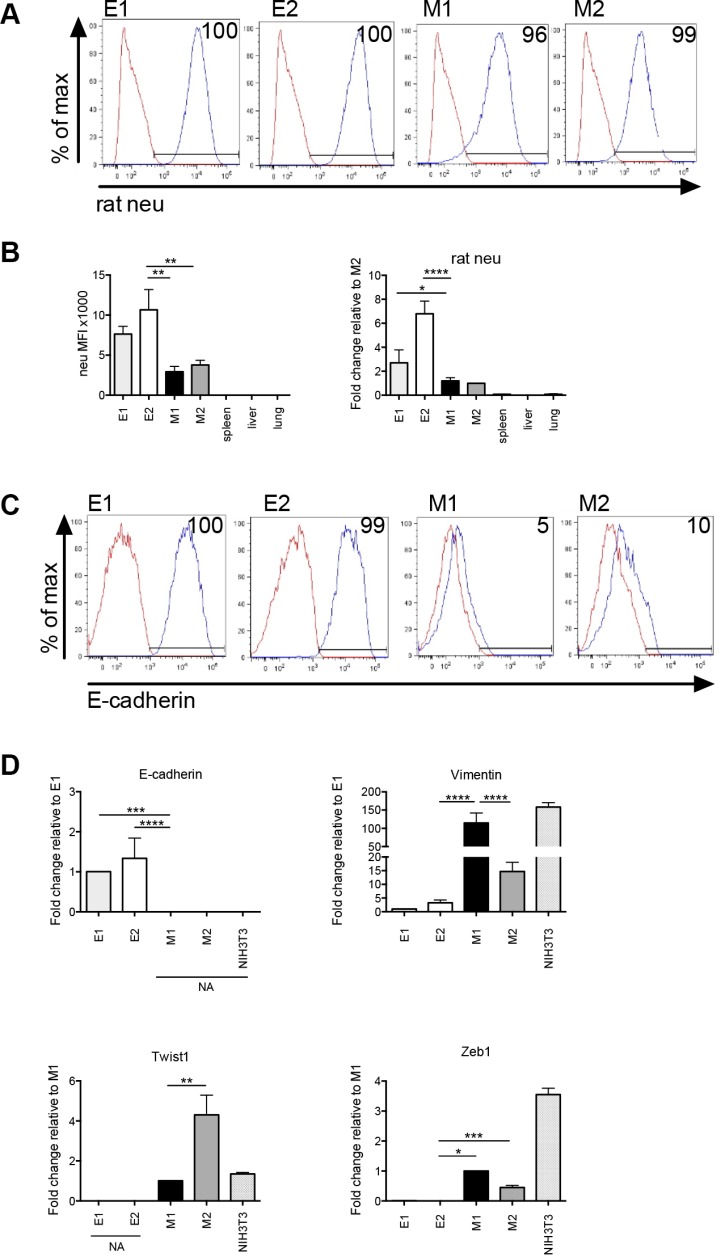
Figure 2. Epithelial and mesenchymal-like clonal cell lines are tumor-derived.
(A) Flow cytometry histograms showing membrane rat neu protein expression. Red histogram = isotype control and blue histogram = neu expression. (B) Flow cytometric mean fluorescence intensity (MFI) values of membrane rat neu protein expression (panel 1). The MFI value was obtained by subtracting the MFI of the isotype control from the experimental value. Real-time quantitative PCR (qPCR) of cell line or tissue cDNA using rat neu specific primers (panel 2). For flow cytometry and qPCR, error bars represent repeats of 3 separate experiments. (C) Flow cytometric analysis of membrane E-cadherin protein expression. Red histogram = isotype control and blue histogram = E-cadherin expression. (D) qPCR showing relative differences in transcript expression of the epithelial marker, E-cadherin, and mesenchymal markers, vimentin, Zeb1 and Twist1 in E1, E2, M1 and M2 cell lines. NIH3T3 cells were analyzed as a mesenchymal cell line control. NA = no amplification signal. Error bars represent the average ΔΔCq from triplicate wells in 3 separate experiments. Statistical analysis was done using ordinary one-way ANOVA with a Tukey multiple comparison test. *p ≤ 0.05, **p ≤ 0.01, ***p ≤ 0.001 and ****p ≤ 0.0001.

