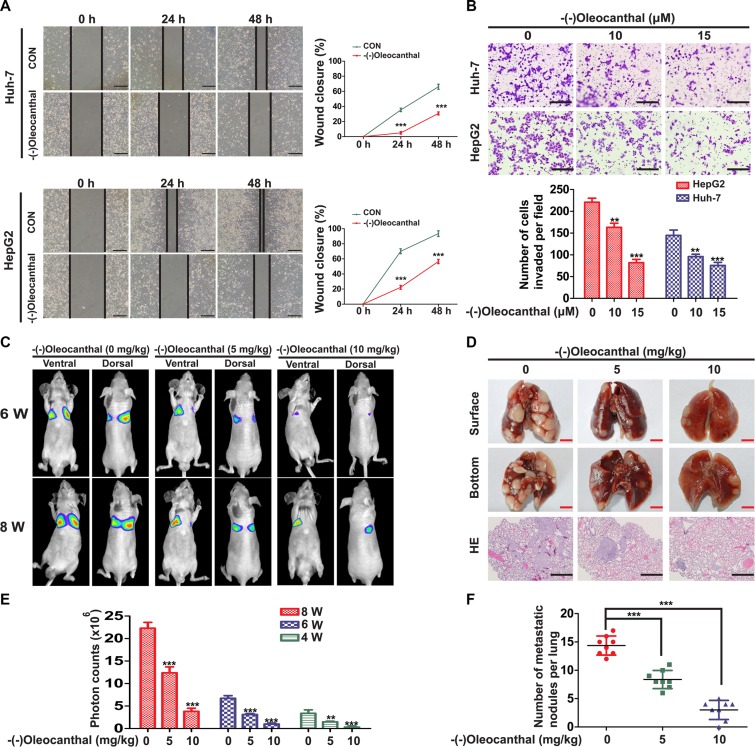
Figure 4. (−)-Oleocanthal inhibits migration and invasion abilities of HCC in vitro and in vivo.
(A) Representative images of cell migration for Huh-7 and HepG2 cells using wound-healing assay after the treatment with 10 μM of (−)-oleocanthal (left panel). The wound closure was quantified at 24 h and 48 h post-wound by measuring the migrated area (right panel). Scale bar = 50 μm. (B) Representative images of invasion assay for Huh-7 and HepG2 cells after the pre-treatment with increasing doses of (−)-oleocanthal for 24 h (top panel). The number of invaded cells was counted (bottom panel). Scale bar = 100 μm. (C) Representative images of mice from bioluminescent imaging at the sixth and eighth week, respectively. (D) The mice were sacrificed and lungs were excised at the end of treatment. Representative images of gross specimen were shown in the top and middle panel. Hematoxylin and eosin staining of lung tissue samples from the different experimental groups were shown in the bottom panel. Black scale bar = 100 μm. Red scale bar = 0.5 cm. (E) Quantification of the tumor growth based on the luciferase intensity. (F) Number of metastatic lung foci was detected in each group. Data was presented as the means ± SD of three independent experiments. ** compared with control, P < 0.01. *** compared with control, P < 0.001.

