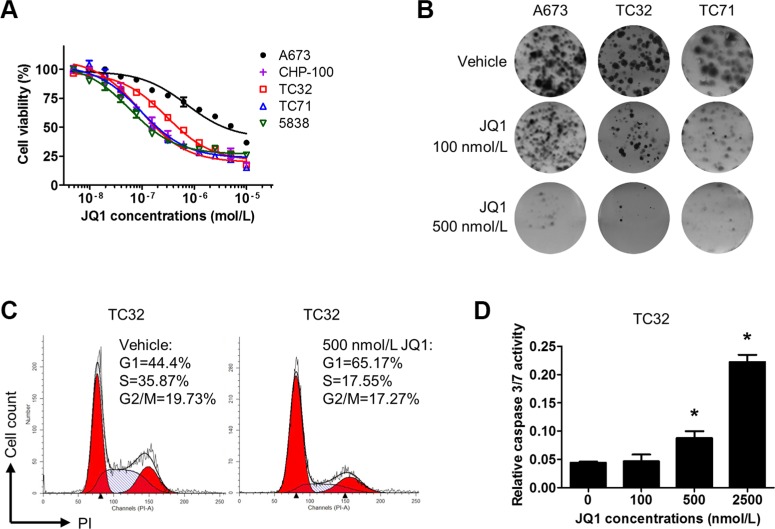
Figure 6. BET inhibition compromises proliferation and survival of Ewing sarcoma cells.
(A) Dose-response curves for JQ1 in Ewing sarcoma cells following a 5-day treatment. (B) 2,000 A673, CHP100, or TC32 cells were treated with 100 or 500 nmol/L JQ1 for 5 days. After drug withdrawal, cells were incubated for 7 more days prior to staining with 0.5% crystal violet. Representative images are shown. (C) TC32 cells were treated with 500 nmol/L JQ1 for 24 hours and fixed for propidium iodide staining. Cell cycle distribution was calculated by the ModFit software. (D) TC32 cells were treated with JQ1 at indicated concentrations for 3 days. Caspase 3/7 activity was determined by the Caspase3/7-Glo kit (Promega) and normalized to cell titer readings of the corresponding groups.

