
Figure 2. Combining ACLY and AR inhibitors suppresses AR target gene expression.
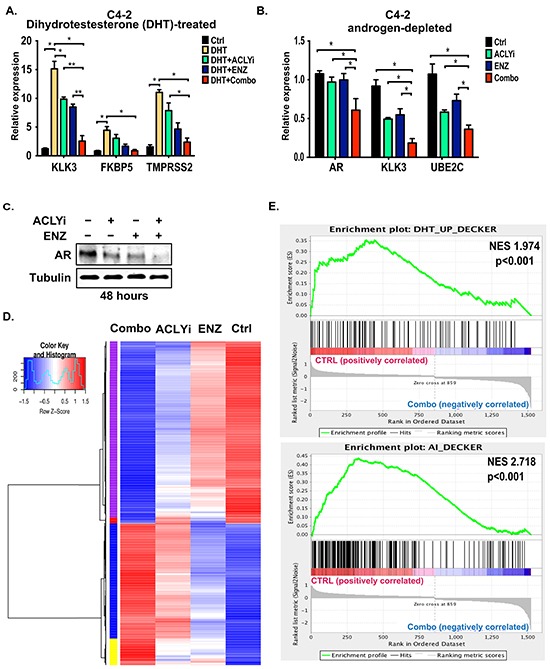
A. C4-2 cells were cultured in androgen-depleted conditions for 24 hours and then treated with DHT (10 nM), +/− ACLYi (10 μM), +/− ENZ (20 μM) for an additional 24 hours. Gene expression was analyzed by Q-RT-PCR and normalized to 18S rRNA. Combo denotes ACLYi + ENZ. B. C4-2 cells were cultured in androgen-depleted conditions for 24 hours and then treated +/− ACLYi (10 μM), +/− ENZ (20 μM) for an additional 24 hours. Gene expression was analyzed by Q-RT-PCR and normalized to B2M. C. Cells were treated with ACLYi or ENZ for 48 hours in androgen-depleted conditions and AR levels analyzed by Western blot. D. C4-2 cells in androgen-depleted conditions were treated with vehicle, ACLYi alone, ENZ alone, or the inhibitor Combo. Genes differentially expressed in any two comparisons (FDR<0.0001) were clustered and are represented in the heat map. See Supplementary Table S1 for associated gene list and cluster ID. E. Gene set enrichment analysis (GSEA) was used to test whether the “DHT-Up” and “Androgen Independent” gene signatures, as defined by Decker et al [7], were enriched in Ctrl vs. Combo-treated cells. Both of these gene sets were enriched in control C4-2 cells as compared to Combo-treated C4-2 cells. Normalized enrichment score (NES) and p-values are indicated. See Supplementary Figure S2 for comparisons between Ctrl vs. ACLYi alone. For all bar graphs, mean +/− SEM of triplicates is graphed; *, p<0.05; **, p<0.01