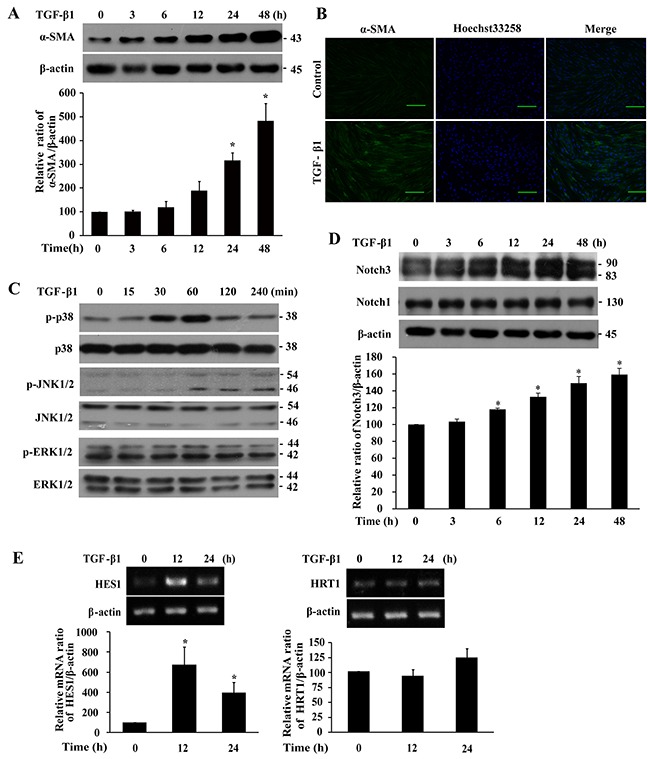
Figure 1. TGF-β1 induces differentiation, p38 and JNK1/2 phosphorylation, and Notch3 expression in IMR-90 fibroblasts.

Cells were serum-starved overnight prior to treatment with TGF-β1 (200 pM) for the indicated duration. A. Western analysis of α-SMA levels. B. Immunofluorescent analysis of α-SMA expression. Green, α-SMA; blue, nuclei; bar size, 100 μm. C. Western analysis of p38, JNK1/2 and ERK1/2 phosphorylation. D. Western analysis of Notch3 and Notch1 levels. E. RT-PCR analysis of HES1 and HRT1 mRNA levels. The bands were quantified, normalized by β-actin or the respective unphosphorylated protein, and presented relative to 0 h (100%) as means ± SEM (n = 3-4). *, P < 0.05 vs 0 h.
