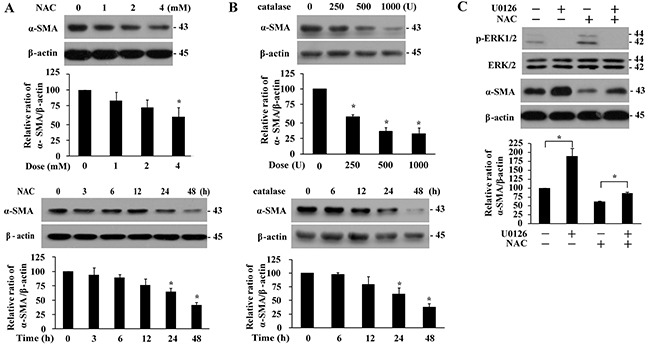
Figure 4. Basal α-SMA expression is suppressed in the presence of antioxidant or by ERK signaling.

Dose- and time-dependent effect of NAC (A, 48 h, upper panels; 4 mM, lower panels) and catalase (B, 48 h, upper panels; 1000 U/ml, lower panels) treatment on α-SMA protein levels in IMR-90 cells. C. Effect of U0126 (10 μM, 1 h) on ERK1/2 phosphorylation and α-SMA protein levels in the presence or absence of NAC (4 mM, 48 h) pre-treatment. The expression levels were quantified and normalized with their respective controls, and presented relative to that without any treatment as means ± SEM (n = 3-4; *, P < 0.05 compared to controls).
