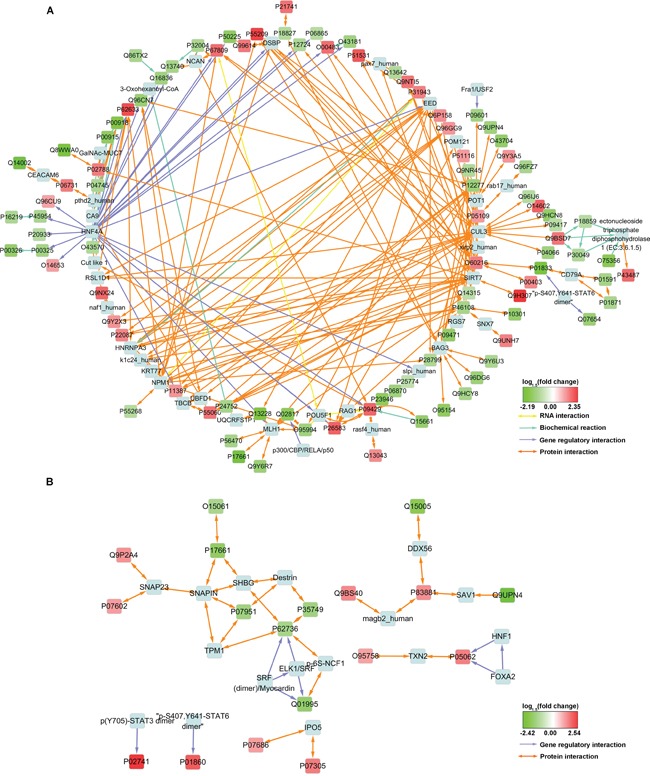
Figure 1. Interaction network constructed with some of the MS-identified DEPs.

Input nodes were colored with log1.5 (fold change) and designated with UniProt Accessions. Intermediate nodes of exogenous proteins introduced by Consensus PathDB were light blue and designated with conventional names. For protein expression measurement information, see Supplementary Table S4.
